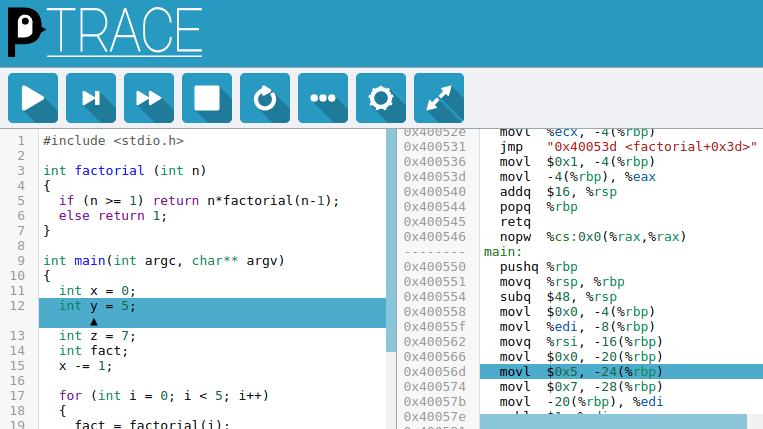
C-programmers who don’t have a mental model of what’s going on underneath their thin veneer of abstraction above assembly code are destined for trouble. In order to provide a convenient way to understand what C-code gets compiled to and how it runs on the machine, [Alex Beharrell] has created penguinTrace, a program which allows you to see what instructions your code compiles to, and examine how it executes.
While you can get somewhat similar functionality out of standard debuggers, penguinTrace was purpose-built to facilitate exploration of how the whole process works. You can single-step through the instructions your code compiled to, examine variables, and look at the stack — the usual debugger stuff — but structured more for exploration and learning than full-on debugging. Based on our experiences when we learned low-level programming, anything that can help novices build that all-important mental picture of what’s going on underneath is a good thing. But, since it was written with a secondary purpose of learning how debuggers themselves work, it’s a great opportunity for exploring that space, too.
The UI harnesses CodeMirror to provide a browser-based interface, and is configurable to use Clang or GCC for compilation. It supports AMD64/X86-64 and AArch64 architectures, and will run on Windows using WSL: if you’ve got a PC running Linux, a Raspberry Pi, or a Windows box, you’re good to go. The code is AGPL-licensed and available on GitHub. So, if you want to gain a better understanding of what happens when you compile and run “hello, world,” grab a copy and start exploring.
This isn’t the only way to debug, though – we previously featured an application that allows a type of debugging for the Arduino platform.


Not sure how that is different to this one https://gcc.godbolt.org/
Compiler Explorer doesn’t allow you to execute the code.
This also lets you trace it’s execution, something that is completely absent with godbolt.
Not good enough, I want it to draw the flowchart as well.
B^)
“I want it to draw the flowchart as well.”
Implement a UML Diagram flowchart do-hicky commit then Ren. Call it what you want too… like the Renchart. :-)
If there’s a thing like this for Python, I need it. I cannot wrap my head around how that language does anything.
Python uses an interpreter, not a compiler. That’s a whole other kind of beast.
still compiles to bytecode
Not that I know at assembly level (but with Python, is it really important?), but at a higher level, you have http://pythontutor.com/visualize.html#mode=edit
It’s important for someone who can’t get his head around Python because it doesn’t make sense what statements actually *do*. I have a goal and I have tools which might ostensibly be used in achieving that goal, but without understanding what each tool does, it’s hard to know where to apply them.
That tutor is really neat! I’ll have to play with that alongside my next attempt at learning the darn snake.
Yeah, Python Tutor is a great tool and does also support C/C++.
It also has very good visualisation of how the stack and heap work for C/C++ code, as well as showing the links between pointers and values. I would like to improve penguinTrace to show the interactions between the code and memory better, but the focus was on the interaction between the code and assembly to start with.
Let me fix that for you:
All programmers who don’t have a mental model of what’s going on underneath their thin veneer of abstraction above assembly code are destined for trouble.
Depends on the application, there are some specific instances where you absolutely have to use assembly because you need cycle by cycle instruction control and higher level languages can wreck havoc unless you know exactly how the compiler will act. I think having knowledge and experience in both high and low level software development is important so I cringe when people try to act like one or the other is always better for every case.
Junior dev here but the comment seems very balanced to me. As engineers we have our pet peeves but we have always to remember that the point is not about tool is better but about what problem we are trying to solve and what is the best solution for that problem.
Well…
I think it would be useful in seeing how others’ code works
I’ve worked with plenty of people who had successful careers as programmers and no idea of how computers worked at the assembly code level.
Yeah, me too. I’d rather work with people who understand how their language works but don’t understand the machine level than work with someone with a perfect understanding of the machine level but a half baked idea of the language.
Have used this – ok but not impressed. Thirty years later we still do not have the functional capabilities of Borland’s turbodebugger and turboassembler.
Tell me about turbodebugger and turboassembler.
I haven’t tried this out yet, but has anyone tested whether it works reasonably with optimized code? i.e. when the instructions are reordered and one line can correspond to multiple instructions spread to many places. It would really help figuring out problems that only appear when compiler optimizations are turned on, such as undefined behavior.
Probably because an old version of gcc with numerous flags was used, but seems to have some levels of weirdness for this where state-machine code is using function pointer tables.
Currently it always compiles with optimisation off, but it uses the same debugging information as gdb etc., so when stepping through optimised code you would find that some lines in the source are skipped or reordered.
When I’d tested with optimised code I’d found that my parsing of the debug information was not always as reliable which is why it isn’t currently an option. It’s something that should be supported eventually.
The focus of penguinTrace was more on learning rather than providing a full debugger, but you can use ‘layout asm’ and ‘layout regs’ in gdb to give similar information, my intention was to provide a simpler interface at the expense of functionality.
Makes me want to start coding again. I did just install Lubuntu 18.04 on the “new” Lenovo x131e with a big 1.7GHz dual core… so looks like I might try this out on. Neat… I’ve been addicted to hardware and that maintenance lately and with the USB 3.0 laptop now… I’ve been wondering what the limiting component is on the RTL-SDR’s and other SDR’s and where to install a USB 3.0 chip so to upgrade those if can… which I’d think can… though need to figure data rates for feasibility I guess.