In previous installments of DSP Spreadsheet, we’ve looked at generating signals, mixing them, and filtering them. If you start trying to work with DSP, though, you’ll find a topic that always rears its head: IQ signals. It turns out, these aren’t as hard as they appear at first and, as usual, we’ll tackle them in a spreadsheet.
What does IQ stand for? The I stands for “in phase” and the Q stands for quadrature. By convention, the I signal is a cosine wave and the Q signal is a sine wave. Another way to say that is that the I and Q signals are 90 degrees out of phase. By manipulating the amplitude of I and Q, you can create complex modulation or, conversely, demodulate signals. We’ll see a spreadsheet that shows that completely next time.
For now, though, consider a sine wave of frequency f that has relative phase Φ. That is just a fancy way to say that if you pick one point to be the “zero” point of a reference sine wave (even if it doesn’t really exist) the wave in question will be shifted over from that point. We saw in the last installment that a sine wave and a cosine wave are the same except for phase and you can model them like this: y=A*cos(2πft+Φ). If the phase angle (Φ) is -90 degrees, you have a sine wave.
Practically Speaking…
In practical terms, changing the amplitude of a signal is easy. The frequency is a bit harder, but we can arrange for that to change, too. Phase is typically hard to modify though. However, with a little trigonometry we can rewrite that equation: A*cos(2πft+Φ)=I*cos(2πft)-Q*sin(2πft)
That’s a remarkable result. By picking the right I and Q values, you can take a cosine and sine wave and create any arbitrary sine wave you like. If you don’t believe it, have a look at the Trig Identity tab on this spreadsheet.
Spreadsheet Time
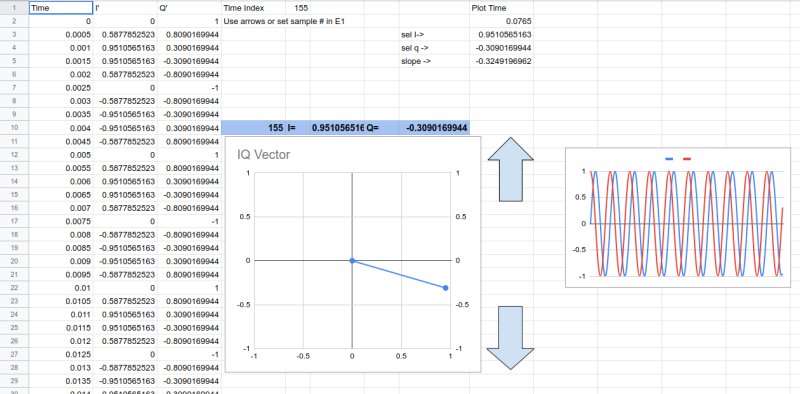
You can set the parameters in column A. Column D is the generated cosine wave using the first formula. Then we generate the zero-phase cosine and sine waves in columns E and F. Finally, we plug in values for I and Q and compute the second equation in column I.
The I and Q values are calculated. At the point where the cosine in column E is 1, column F will be zero. That means that column D will contain the I value. By the same token, at the point that the sine in column F is 1, the cosine must be zero and, again, column D will have the negative of the Q value (because remember, the Q term is subtracted).
Playing with this is quite illustrative. Try phase angles of 0 degrees, 45 degrees, 90 degrees, and 180 degrees. What happens to the I and Q values? What happens to the graphs?
It is handy to plot the amplitude of the I and Q on a graph where the I component is on the X-axis and the Q is on the Y-axis. You can treat this as a vector — that is, draw a point at (X,Y) = (I, Q) and then draw an arrow from the graph origin to the point. The phase angle of the signal will be the angle between the X axis and the arrow.
A Little Trig
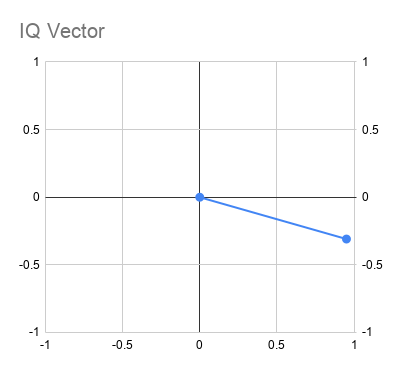
When you plot a vector like the one here, keep in mind that if you count I as X, Q as Y, and the length of the vector as r, the following relations that include the angle the vector forms with the X-axis (Φ) are true:
r=(x2+y2)1/2
cos(Φ)=x/r
sin(Φ)=y/r
You might also find the following useful:
tan(Φ)=sin(Φ)/cosΦ=y/r
sin2(Φ)+cos2(Φ)=1
Thought Experiments
You’ll get more chances to play with these diagrams in the next installment of this series, but for now, consider this. If Q was always zero, you’d get a straight horizontal line with the magnitude of I. If I were zero, you’d get a horizontal line with the magnitude of Q.
However, for a sine wave, the only zeros come at 1/2 the frequency. For a cosine wave, the zeros start at time zero and also repeat every 180 degrees.
Make a copy of the spreadsheet and overwrite the values at locations I3 and I4. If you make I and Q the same you will get a vector that is either 45 degrees or 225 degrees. If you make the magnitudes the same but the signs different you will split the other quadrants. What happens if I is greater than Q or vice versa?
If you set columns B and C to be a sine wave and use the arrow keys on the original spreadsheet (this requires a simple script; you can also just plug an index into E1), you’ll see the vector rotates along with the sine wave’s motion. What happens if I is a sine wave and Q is a cosine wave or vice versa?
How Do You Get There?
How do you get an arbitrary signal into IQ form? The most common way is to mix it — something we already know how to do — with a reference cosine and sine wave. However, there are other ways, like the Tayloe detector in the video below.
We will see more of the conventional method next time, but you should really take time to play with these models and get a good feel for how signals decompose into IQ samples.


Thank you for this interesting series. Could you do something on “correlation” for detecting signals please?
tan(Φ)=sin(Φ)/cosΦ=y/x
The spreadsheet doesn’t match to the explanation given with regard to the columns referenced.
You need to look at the Trig Identify tab and the switch to the plot tabs.
If I was zero, you would get a straight vertical line with the magnitude of Q.