Organise Your Hacks With TreeSheets: An Open Source Hierarchical Spreadsheet

Some people may have heard of Dutch programmer [Wouter Van Oortmerssen] since he’s the creator of the Amiga-E programming language, as well as being involved with several game engines. Heard of SimCity? How about Borderlands 2 or Far Cry? Having had clearly a long and illustrious career as a programmer for a variety of clients — including a long stint at Google, working on Web Assembly — many people will be familiar with at least some of his work. But you may not have heard of his TreeSheets productivity tool. Which would be a shame, as you’ve been missing out on something pretty darn useful.

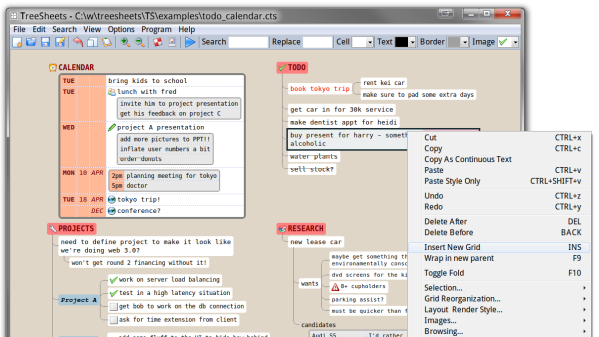
TreeSheets is described as a hierarchical spreadsheet, which is intended as a replacement for several distinct tools; think spreadsheets, mindmaps and text editors and similar. In [Wouter]’s words:

It’s like a spreadsheet, immediately familiar, but much more suitable for complex data because it’s hierarchical.
It’s like a mind mapper, but more organized and compact.
It’s like an outliner, but in more than one dimension.
It’s like a text editor, but with structure.

Having been in development for about a decade, TreeSheets might look a bit dated here and there, but the design is clear and distraction-free, which is exactly what you need when you’re trying to focus on the task in hand. Why not give it a try and see if it works for you? After the break, you can see a video tutorial by YouTube user [DrilixProject].

No strangers to productivity hacks, here’s Pomodachi, a cute pomodoro timer crossed with a Tamagotchi. Sometimes productivity isn’t solved with software tools, but more to do with your attitude to projects. Finally sometimes the route to greater productivity is a little closer to home, like inside your head.

Continue reading “Organise Your Hacks With TreeSheets: An Open Source Hierarchical Spreadsheet”

DSP Spreadsheet: The Goertzel Algorithm Is Fourier’s Simpler Cousin

You probably have at least a nodding familiarity with the Fourier transform, a mathematical process for transforming a time-domain signal into a frequency domain signal. In particular, for computers, we don’t really have a nice equation so we use the discrete version of the transform which takes a series of measurements at regular intervals. If you need to understand the entire frequency spectrum of a signal or you want to filter portions of the signal, this is definitely the tool for the job. However, sometimes it is more than you need.

For example, consider tuning a guitar string. You only need to know if one frequency is present or if it isn’t. If you are decoding TouchTones, you only need to know if two of eight frequencies are present. You don’t care about anything else.

A Fourier transform can do either of those jobs. But if you go that route you are going to do a lot of math to compute things you don’t care about just so you can pick out the one or two pieces you do care about. That’s the idea behind the Goertzel. It is essentially a fast Fourier transform algorithm stripped down to compute just one frequency band of interest.  The math is much easier and you can usually implement it faster and smaller than a full transform, even on small CPUs.

Continue reading “DSP Spreadsheet: The Goertzel Algorithm Is Fourier’s Simpler Cousin”

Little Hex Tricks Make Little Displays A Little Easier

Depending on the device in hand and one’s temperament, bringing up a new part can be a frolic through the verdant fields of discovery or an endless slog through the grey marshes of defeat. One of the reasons we find ourselves sticking with tried and true parts we know well is that interminable process of configuration. Once a new display controller is mostly working, writing convenience functions to make it easier to use can be very satisfying, but the very first thing is figuring out how to make it do anything at all. Friend of Hackaday [Dan Hienzsch] put together a post describing how to use a particular LED controller which serves as a nice walkthrough of figuring out the right bitmath to make things work, and includes a neat trick or two.

The bulk of the post is dedicated to describing the way [Dan] went about putting together his libraries for a 7-segment display demo board he makes. At its heart the board uses the IS31FL3728 matrix driver from ISSI. We love these ISSI LED controllers because they give you many channels of control for relatively low cost, but even with their relative simplicity you still need to do some bit twiddling to light the diodes you need. [Dan]’s post talks about some strategies for making this easier like preconfigured lookup tables with convenient offsets and masking bits to control RGB LEDs.

There’s one more trick which we think is the hidden star of the show; a spreadsheet which calculates register values based on “GUI” input! Computing the bit math required to control a display can be an exercise in frustration, especially if the logical display doesn’t fit conveniently in the physical register map of the controller. A spreadsheet like this may not be particularly sexy but it gets the job done; exactly the kind of hack we’re huge fans of here. We’ve mirrored the spreadsheet so you can peek at the formulas inside, and the original Excel document is available on his blog.

DSP Spreadsheet: Talking To Yourself Using IQ

We’ve done quite a bit with Google Sheets and signal processing: we’ve generated signals, created filters, and computed quadrature signals. We can pull all that together into an educational model for two SDRs talking to each other, but it’s going to require two parts: modulation and demodulation. Guess what? We can do that with a spreadsheet.

The first step is to generate a reference clock for the carrier. You’ll need a cosine wave (I) and sine wave (Q). Of course, you also need the time base. That’s columns A-C in the spreadsheet and works like other signal generation we’ve seen.

Continue reading “DSP Spreadsheet: Talking To Yourself Using IQ”

DSP Spreadsheet: IQ Diagrams

In previous installments of DSP Spreadsheet, we’ve looked at generating signals, mixing them, and filtering them. If you start trying to work with DSP, though, you’ll find a topic that always rears its head: IQ signals. It turns out, these aren’t as hard as they appear at first and, as usual, we’ll tackle them in a spreadsheet.

What does IQ stand for? The I stands for “in phase” and the Q stands for quadrature. By convention, the I signal is a cosine wave and the Q signal is a sine wave. Another way to say that is that the I and Q signals are 90 degrees out of phase. By manipulating the amplitude of I and Q, you can create complex modulation or, conversely, demodulate signals. We’ll see a spreadsheet that shows that completely next time.

Continue reading “DSP Spreadsheet: IQ Diagrams”

DSP Spreadsheet: Frequency Mixing

Circuit simulation and software workbooks like Matlab and Jupyter are great for being able to build things without a lot of overhead. But these all have some learning curve and often use clever tricks, abstractions, or library calls to obscure what’s really happening. Sometimes it is clearer to build math models in a spreadsheet.

You might think that spreadsheets aren’t built for doing frequency calculation and visualization but you’re wrong. That’s exactly what they’re made for — performing simple but repetative math and helping make sense of the results.

In this installment of the DSP Spreadsheet series, I’m going to talk about two simple yet fundamental things you’ll need to create mathematical models of signals: generating signals and mixing them. Since it is ubiquitous, I’ll use Google Sheets. Most of these examples will work on any spreadsheet, but at least everyone can share a Google Sheets document. Along the way, we’ll see a neat spreadsheet trick I should probably use more often.

Continue reading “DSP Spreadsheet: Frequency Mixing”

DSP Spreadsheet: FIR Filtering

There’s an old saying: Tell me and I forget, teach me and I may remember, involve me and I learn. I’m guilty of this in a big way — I was never much on classroom learning. But if I build something or write some code, I’m more likely to understand how it works and why.

Circuit simulation and software workbooks like Matlab and Jupyter are great for being able to build things without a lot of overhead. But these all have some learning curve and often use clever tricks, abstractions, or library calls to obscure what’s really happening. Sometimes it is easier to build something in a spreadsheet. In fact, I often do little circuit design spreadsheets or even digital design because it forces me to create a mathematical model which, in turn, helps me understand what’s really going on.

In this article I’m going to use Google Sheets — although you could do the same tricks in just about any spreadsheet — to generate some data and apply a finite impulse response (FIR) filter to it. Of course, if you had a spreadsheet of data from an instrument, this same technique would work, too.

Continue reading “DSP Spreadsheet: FIR Filtering”