As the world has become more environmentally conscious, we’ve seen an uptick in projects that monitor or control home energy use. At a minimum one of these setups involves a microcontroller and some kind of clamp-on current sensor, but if you’re looking for resources to take things a bit farther, this Raspberry Pi energy monitoring system created by [David00] would be a great place to start.
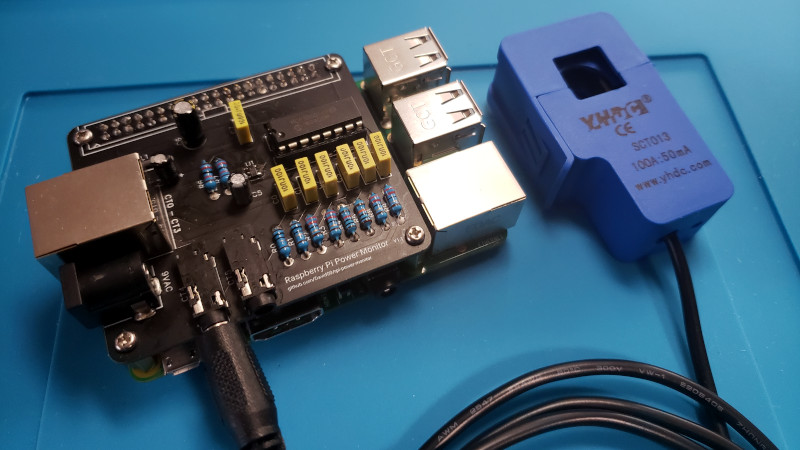
This project includes provides software and hardware to be used in conjunction with the Raspberry Pi to keep tabs on not just home energy consumption, but also production if your home has a solar array or other method of generating its own power. Data is pulled every 0.5 seconds from a MCP3008 ADC connected to up to five six current sensors to provide real-time utilization statistics, and visualized with Grafana so you can see all of the information at a glance.
While [David00] has already done the community a great service by releasing the hardware and software under an open source license, he’s also produced some absolutely phenomenal documentation for the project that’s really a valuable resource for anyone who wants to roll their own monitoring system. He’s even offering hardware kits for anyone who’s more interested in experimenting with the software side of things than building the PCB.
Home energy monitoring projects are certainly nothing new, but the incredible advances we’ve seen in the type of hardware and software available for DIY projects over the last decade has really pushed the state-of-the-art forward. With so many fantastic resources available now, the only thing standing between you and your own home energy monitoring dashboard is desire and a long weekend.


How much power does that Pi use to try to save a couple of watts ?
Dude, it’s a pretty cool project, it’s really fun and educational, plus it brought a ton more knowledge into the hacker’s world about how those devices work. Not everything is about a dry mathematical gain you know.
Your comment sums up the arrogance and ignorance of the thinking that has got us where we are.
A fan heater is between 2000W and 3000W, a kettle is standard 3000W.
A raspberry Pi uses on at max 3Ax5V=15W
Very basic understanding of energy usage would show the benefit and importance of knowing that not all things with a plug, use the same energy!
>A fan heater is between 2000W and 3000W, a kettle is standard 3000W.
>Very basic understanding of energy usage
While I agree the guys comment is extremely arrogant you should look up actual energy usage yourself. It’s obvious from your comment you don’t have a ‘very basic understanding of energy usage’ either.
The max draw of a typical NEMA 5-15 outlet is 1,800 watts. A space heater uses 500-1500. An electric kettle between 700 – 1,800. You should look things up before bashing someone or you just look just as ignorant.
Someone obviously lives in the US and is used to 110V ;)
Much of the world uses 220V with much higher power limits for regular outlets. Literally the first result for kettle on amazon.co.uk is 3000W:
https://www.amazon.co.uk/Electric-Cordless-BPA-Free-Shut-Off-Protection/dp/B08SLX78VN/ref=sr_1_1_sspa?dchild=1&keywords=kettle&qid=1631332327&sr=8-1-spons&psc=1&smid=A2C8D81JOR981A&spLa=ZW5jcnlwdGVkUXVhbGlmaWVyPUEyNEIzMFFWTjhMVUtaJmVuY3J5cHRlZElkPUEwMjg4NDE0MjgwUDZRQldEUkFDQyZlbmNyeXB0ZWRBZElkPUEwMTAyMDg4MzE0TUNDQU41ME5SQSZ3aWRnZXROYW1lPXNwX2F0ZiZhY3Rpb249Y2xpY2tSZWRpcmVjdCZkb05vdExvZ0NsaWNrPXRydWU=
We are 240v in AU and most appliances at the higher end sit at 2400w as we tend to stick to a 10amp max…
As for the original comment, combine this project with my solar and a screen in the kitchen and you can balance your daily usage to try and maximise your solar usage… as well as hunt down power hungry devices that you may not recognise as chewing a lot of power… I’m sure it will pay itself off in the long run… and it’s a little cool too… 😎
2000w * 30 minutes = 1000wh. Kettle
15w * 24 hours = 360 wh rapserry
Worth it
Well… sometimes the raw data that the oven/iron is turned off is worth it
I see what you’re getting at, but if that Pi is already being used for something else (NAS, webserver, etc), why not use the spare CPU.
Very, very little compared to most household appliances. So little that it probably cannot measure it’s own power usage against the backdrop of household appliances. You’re worried about a few watts when the device is being used to help prevent the overuse of kilowatts.
Yes, that!
Rpi4 running this will use something between 650 milliwatts (idle) to 900 milliwatts (unlikely but it draws around this when taxed). So 0.64 watts idle – 0.9 watts, maxed out will be about 0.0216 kWh per day, or 7.884 kWh per year. By comparison, an A++ EU energy rating on a fridge is awarded for devices using 280 kWh per year or less.
less than 1 watt for Rpi4?!?
In my case I think your point is well taken. I did a power generation and consumption project with a Raspberry Pi on my 45W Harbor Freight solar panel system. In that case the 4w or so consumed by the 5v power supply and the Pi was significant! Worried about the marine battery voltage over night after an overcast day, I ended up adding an Arduino running a crude clock which put the Pi to sleep at night and woke it up in the morning. Was a rube system, but it was fun and educational to fight with it.
good to know. Was thinking about running my Pi directly from a battery that is being charged by a solar panel because of the conversion losses in the power supply. Anyhow, my project only needs to run during the day anyway.
I run my 32 inch TV and pi with tb external drive for 24 hous on 2 car batteries my third battery runs lights approx 48 hrs . With TV and pi box and external I bounce between 10 and 0 wats
Deep cycle batteries would be much more effective
Wouldn’t a DC/DC converter be a better option?
How do you reduce energy consumption in a meaningful way if you can’t quantify what you are using in a timely manner? Pinheads don’t care about excessive consumption because more always means better in their books.
Nice project, good effort, thank you for sharing!
This is an old post, but I have to comment.
Pinhead, I am not sure what country you are in – but it must be the North Pole.
For the rest of us, living south of the pole, it’s a useful project.
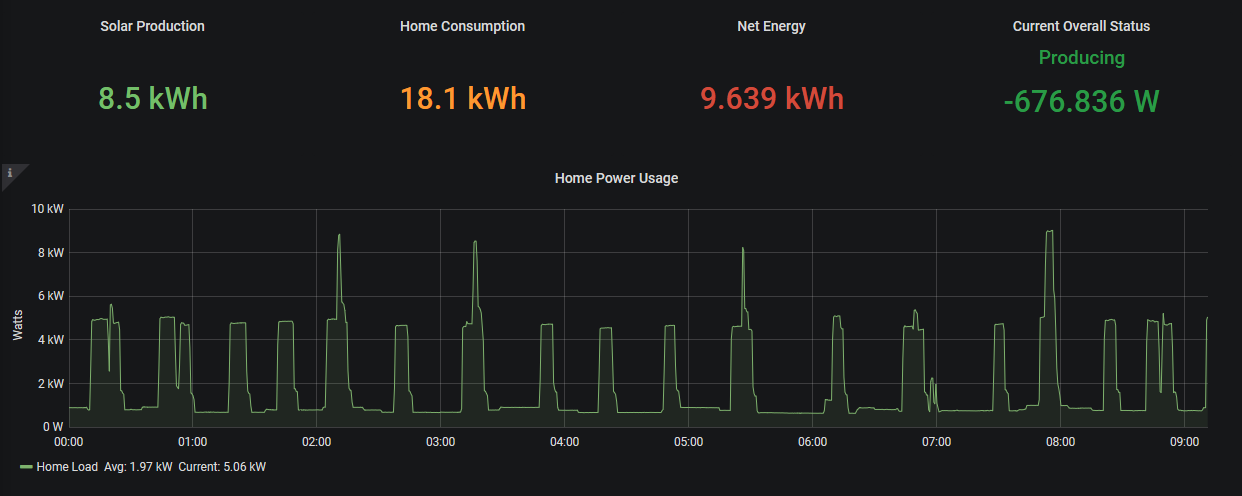
If you are just looking at power consumption, the graph shows a periodic 4kW that turns on about twice an hour. This is usually water heating and means that something is wrong with the insulation of the water heater. If they are short spikes, then all is ok. Lengthy pulses mean its loosing energy. So that’s the use for the project if you are not interested in solar power. It’s not the 15W for the pi (which in reality is more like 7 watts, it’s the fact that can diagnose a problem that consumes KW.
This tool is not intended for you to save a watt on your router or your kettle.
You can calculate that. It is intended to assist in finding problems where power is consumed and should not be.
It is invaluable when deciding to fit solar.
You need something like this before solar installation to monitor for a while to be able to properly define the number of panels you need and the battery capacity that will be needed.
I purchased monitoring units from the UK which were thrown in the dirtbin as they could not do what this project does.
Thank you Tom for doing most of the hard work for me.
I’m interested in this… being able to see I’m generating more power then I’m using means I can go and turn the clothes dryer on… or I’m in importing power from the grid I might be inclined to turn my AC off or down??? Effectively saving more then a few watt hours…
Nice!. And good documentation.
I am doing something similar with esp32 and PZEM-004T modules at home. Data is handled by a MQTT server for storage and monitoring.
Does this just monitor overall usage, or is it able to recognise the power signature of different appliances and allow you to discover that the washing machine just finished a cycle, or the soldering iron as been left on? That would be a really cool extension.
Is this implementation single phase only, or can it be adapted to 3 phase?
Read the article?!
“… up to five current sensors …”
I expect Medix means if it can cope with other voltages then 230 (208V or 400V) or if it can distinguish between the different phases. Google “three phase power line” if you are confused ;)
Exactly, 5 sensors is fine, but I wanted to know if the software is written to account for phase differences, etc to measure 3-phase power (not as straightforward as single phase).
Sure, I could modify it myself, but why re-invent the wheel if it’s already been done!
there’s no support for input voltage, so It can’t really distinguish reactive power nor calculate real power.
Just sticking an ADC to a PI and taking 0.5sec snapshots means that OP is assuming that all measurement comes from pure resistive loads. The results won’t be the same as what the utilitity company measures.
You would either use a energy monitoring chip (e.g. see link below) or have at least have a microcontroller real time sampling the instantaneous power to calculate the real power.
https://www.microchip.com/design-centers/utility-metering-solutions/power-monitoring
Hi, David00 (project creator) here…
The software does not currently support 3-phase power monitoring. It can be expanded to support 3-phase, but right now, it is only intended for single/split-phase systems.
Also, there is an error in the article – I will try to contact the author. The project supports up to 6 total current transformer inputs, not 5. :)
I can’t reply to atomd or tekkieneet directly – not sure why, but I wanted to correct their assumption on the capabilities of my project.
atomd said in a comment below:
“there’s no support for input voltage, so It can’t really distinguish reactive power nor calculate real power.”
The project does have a requirement for AC input source voltage. In the documentation, I have listed the requirement for a 9V AC power supply. This is used to sample the AC grid voltage for phase and level.
tekkieneet said in a comment below:
Just sticking an ADC to a PI and taking 0.5sec snapshots means that OP is *assuming* that all measurement comes from pure resistive loads. The results won’t be the same as what the utilitity company measures.
You would either use a energy monitoring chip (e.g. see link below) or have at least have a microcontroller *real time* sampling the instantaneous power to calculate the real power.”
Your comments are correct, but that’s not how my project works. :)
There is no assumption that all loads are purely resistive – this project is capable of measuring and calculating real power from ALL types of loads. The code takes tens of thousands of samples per second from all inputs, corrects for phase errors incurred by the very short time delay between samples, then calculates instantaneous power in order to get a truly accurate real power calculation.
You don’t NEED an energy monitoring chip to accurately measure power – sure, the dedicated monitoring chips would be slightly more accurate, but they’re also limited in the number of inputs they accept.
Last time I did 3-phase power measurement, I had 8 pairs of sample and hold on the inputs of a data acquisition system (that I designed). The voltage channels and current channels were sampled and exported to a spreadsheet where the power are calculated. I had my result compared to a lab grade box that does proper 3-phase power measurements.
Calibration is not as difficult at least in my case as the voltage and current sensors can handle DC, so taking enough data point, run that on linear regression on the spreadsheet for the slope. offset, residuals etc. Based on how well the data is fitted, one can use a simple linear fit or piecewise linear fit over the range to handle non-linearity.
These day, I would have used the cheapo STM32F103 ($2 Blue Pill) as it has 2 independent 12-bit 1Msps ADC. The ADC can be triggered off hardware timer without software intervention and results stored via DMA. It won’t have software jitters like the RPi. Sample the voltage and current on the pair of ADC and you won’t have to mess around with phase shifts.
“… it brought a ton more knowledge into the hacker’s world about how those devices work.”
The information is poor quality and does not address the fundamentals of data acquisition for power monitoring.
“Not everything is about a dry mathematical gain you know.”
Oh geez, just no. Please turn in your geek/nerd card. Numbers are everything. Whether you are a plumber, bus driver, or disc jockey, numbers matter. Math is not dry. It explains everything. Where the math is missing, all is suspect.
About the ‘numbers’. A 10 bit ADC, where the INL, DNL, Vos and other stuff are at least 8 LSB over a 50 degree temperature range; and where there is no controlled Vref, where there is no input Z for a SAR converter, where the “calibration” is only a simple scaling factor, we can only assume that the “dry math” is suspect. His six digits of data is fantasy and has no meaning.
That’s a bit harsh, but a point well taken that citing six digits of precision is beyond the capabilities and limited calibration and reference source available to the hardware. I have taught electronics for quite a few years, and at the outset of my courses students never cease to write down figures with fewer than whatever number of digits show up on their calculators. That’s even when the measurements being taken have uncertainty of perhaps +/- 5% of the reading. It takes more effort for students to account for the sources of uncertainty, but I work on getting students to cite their final answers with appropriate precision and a +/- percent total accuracy. I’m old enough that I started out on a slide rule (thankfully very briefly) and then moved to using an HP calculator that defaulted to reading out just a few digits to the right of the decimal point. HP obviously had designers that appreciated displaying numbers with precision that makes engineering sense.
I still have to chuckle when I see an answer like -20.000625 dBm when students are taking readings by looking at the screen of an oscilloscope for a lab exercise.
Having said all that, this project should still be plenty useful for helping a home owner identify and track power use.
Hi There,
David00 (project creator) here. I just wanted to correct you on one point regarding calibration. The calibration is not just a simple scaling factor as you’ve suggested. I’ve written a complex phase correction algorithm to adjust for phase errors brought about by the time between samples and the inherent phase error in each CT. Please see the theory section I’ve described here which describes part of the calibration process for this project.
https://github.com/David00/rpi-power-monitor/wiki/Phase-Correction-Theory
Lastly, this is a hobbyist grade power monitor – it is not intended to compete with commercial revenue grade monitoring systems striving for absolute accuracy.
FYI: You are talking about phase correction for the individual ADC channel. This is more or less a fixed phase shift errors that are common to the same hardware.
Brian and Bill talking about the calibrations needed to take care of ADC accuracy – linearity, offsets etc (+ error introduced by thew current sensors) The latter is needed for calculating the readings accurately for *individual* systems for component tolerances/variations etc.
Oh, yes, thank you for clarifying!
I have not gone into correcting for ADC accuracy itself. I feel that going down that level of detail would require a highly accurate calibration source which most homeowners don’t have access to. I think that, given the intended scope and audience of this project, calibrating using a simple scaling factor AFTER the inherent phase errors have been corrected for, against a common Kill-A-Watt or consumer grade AC clamp meter, was sufficient.
@David00,
Truly, this is a great effort and with your understanding at this point, I cant help but think you would be great at helping me with monitoring gas sensors like the MQ-4. Im a complete noob and I need to spend more time doing projects like this than going at it alone. Thanks for this.
Such a useful tool! I’ve been wondering what various things around the house are drawing while I’m away or in my daily activities.
The kitchen range is an on-demand device as it is not on all day, but when I turn on my desktop computer, what does it draw?
If I turn on the subwoofer/speakers, what’s the draw now? When I turn on the Tripp-Lite 12V/40A power supply, what is the draw?
How does power draw change when I have the Elecraft K3 (ham radio transciever) receiving? Transmitting?
These have largely been unknowns, wadded up in the power bill at the end of the month, where I could expect my hobby activities contribute here and there to the power consumption in the house. Now I could put this device on a cord and witness impact I have on contributions to my overall power consumption by monitoring the optional devices around the house.
Useful! (So no wonder I see unthinking, visionless critiques of it.)
Hi everyone – this is David00 (project creator) here!
I wanted to stop by and leave a comment because I’m seeing some incorrect assumptions being made and posted by people in this comment section. Also Tom, thank you for featuring my project in your post – there is one typo, though, and that is the project supports 6 total current transformer inputs (not 5).
1. The project is able to calculate real power from ALL types of loads. The project takes tens of thousands of samples per second from up to 6 current transformers and one required AC voltage input source, corrects for phase errors, calculates instantaneous power, then calculates real power, apparent power, and power factor. This project inspects the harmonics of each individual current transformer. It does not just read the ADC and print the value.
2. The project does not currently support 3-phase monitoring. It is theoretically capable of it, with some major assumptions being made about the two other phases that can’t be sampled, but if you just want to get an idea of 3-phase power consumption with no real requirements for accuracy, the project in its current state can be modified to support it.
3. I really do appreciate the input from seasoned electrical engineers with a career full of experience. However, I would like to kindly remind these folks that this project is NOT striving to compete against the accuracy of solutions from the likes of Siemens, Fluke, etc. This project is for home monitoring from a DIY/hobbyists perspective… and the cost of the hardware involved reflects that!!
I’m looking for a similar project that uses an esp32, which already includes wifi and several (8?) adc inputs and costs much less (2€), is much smaller and uses much less energy. Maybe not as precise but I dont need high precision, i just want a low cost, many-input monitor to install in my fusebox to find out which of my 20 circuits in the house are using the energy that i see on the main meter (several 100w overnight).
These current sensors are pure sh*t. We used them and found them to be way off their specs too often. And due to their size they aren’t very good at measuring small loads. Aaand I wanted to point out that there is an open source project doing the exact same thing with a raspberry and these current sensors: emonPi (openenergymonitor). It’s much more mature and comes with proper software.
If you had a look at the project documentation, you’d see that this project is derived from OpenEnergyMonitor. Also, if you were familiar with their project at all, you’d have seen that they thoroughly tested the YHDC SCT-013-000 and found it to be sufficient for this purpose.
Project documentation: https://github.com/David00/rpi-power-monitor/blob/master/README.md
YHDC SCT-013 sensor test report: https://learn.openenergymonitor.org/electricity-monitoring/ct-sensors/yhdc-sct-013-000-ct-sensor-report
Can I juist comment David00 for tirelessly addressing the (for all I know, valid) remarks of bystanders? Thank you.
David00 — this looks great.
I have a similar but lower-tech setup in my own home: in my case, two CTs in the panel feeding into a ESP8266, using the same ADC as you use. I have them sample about 0.5 s (can’t remember exactly how much) of the current waveform every 20 sec and then calculate Irms from that.
I don’t need metering-grade accuracy — but in my testing, found that the current draw my setup measured was within a few percent of a Kill-a-Watt type meter. That is good enough for my purposes. I haven’t bothered getting an AC-AC transformer to calculate power.
I had a professional electrician put the CTs in my panel for me.
In my case, the ESP8266 sends current draw info via MQTT to a broker running in-house, which then sends it on to InfluxDB running on an Amazon Lightsail VPS. Grafana then visualizes it.
My system also has temperature / humidity sensors in a few rooms in the house, as well as a temperature sensor in the main furnace outflow duct. The combination of being able to see current draw and the performance of my HVAC system has been very valuable. I don’t have an algorithm to distinguish the different loads from one another, but can usually tell by looking at the graphs.
Some things that this setup has done for me: (a) Revealed a problem with the fuser on my MFD laser printer. (b) Revealed the cause of a failure with the main board on my furnace. (c) Revealed the cause of the failure of my AC compressor. (d) Revealed the cause of a slow warm-up cycle on my oven.
If I wanted metering-grade, I’d buy a professional system. For now, what I have is great, and its cost has been paid back at least 10-fold by catching problems before they get worse.
so many negative comments!
the details of this “horrible!” project are out there so you can fix it. didn’t your parents ever tell you “share a nice pull request or don’t share anything at all”?
“cranky, combative” is just not a good look for you… yes, you.
@David00 and to any other who may have the answer.
Thank you for this very interesting project. I currently have the parts on order and am eagerly waiting delivery to put it together.
In the meantime, can you explain why you chose the 000 version of this CT sensor series. The others seem to convert directly to a voltage which would seem to be easier to interface to an ADC chip.
What am I missing?
Hey Joe! I’m glad you’re trying out my project.
The reason I went with the 000 version of the YHDC current transformer is because it puts out a current and not a voltage. The other type of CT – the ones that put out a voltage – don’t allow us to take advantage of the full resolution of the ADC input. In this project, the ADC can accept up to a 3.3V input. Those “voltage output” CTs put out 1V, if I remember. The inputs are biased by +1.65V, so that means that the “voltage output” CTs can only put out maximum voltage of 2.65V, when the ADC can accept up to 3.3V. By not utilizing the full input voltage range, the CTs essentially operate at a lower resolution, and that can have impacts on accuracy.
Since this article was posted, I’ve launched a website for the project where I have various rated CTs available. You can also get in touch with me through the contact form on my website if you have any questions with your setup. Feel free to check it out!
https://power-monitor.dalbrecht.tech
Hi David,
Thank you very much for your speedy reply. Your explanation of why you went for the 000 version makes a lot of sense.
I will probably be in contact later on with more questions when I start putting the parts together. Regards
Hi David, Great Project. Very interesting.
I’ve been looking for something very similar to primarily monitoring my solar production. As well as power consumption by the house appliances.
I live in Adelaide, Australia. I wonder if I’d need to change anything (software or hardware) in order to get this working.
Hi Parveen. Thanks for your feedback!
It will definitely work for you in Australia, so long as you have a single phase electrical supply. No hardware changes are needed, and the higher line voltage is accounted for in software during the calibration process that you’ll have to go through. If you have further questions, the contact form on my website is the best way to get in touch with me:
https://power-monitor.dalbrecht.tech/contact-2/
Thanks!
David
Interesting. I am looking to connect up to 12 CT units to one Pi. Has anyone done this? What web based monitoring would you recommend?
This doesn’t truly work. Only one out of the two 120v legs are monitored by the 9v adapter, so if your cv is on a different one and its voltage is out of sync, ur readings will be wildly in accurate.
This also means monitoring 240v circuits are impossible.
Hey, thanks for your feedback on my project.
I would love to invite you to review the project (it’s 100% open source!) and discover how I’ve solved the issues you mention. Split phase panels and 240V circuits are no problem.
PS – North America is really the only country that uses split-phase electrical panels. The majority of the world uses 230V single-phase, so your concerns are essentially invalid for most residential electrical systems in the world ;)
Split phase is done in Japan also.
Just saying.
I wanted to do a project around my old Model B RPI and since this excellent project is not recommended for such old hardware I opted to trim down the niceties of this software to the basic requirements for a single phase power monitor.
I now would like to adapt my project to monitor 3 phases without the need to monitor the voltage of each phase.
Is there any algorithm out there which can allow me to shift the voltage samples I collect from one of the phases by +120 and -120 so that I can them combine the results with the current samples from each phase to get to the actual power?
I understand that actual phase shifter routine in this project works well but only for very small angles changes.
Thanks for any insight.
Hi Joe, project creator here – thanks for dropping a comment. I have some good news on a couple of different points.
First, I am working on rewriting my code and in C which will drastically reduce the load imposed from the sampling and calculations, allowing the code to run on older hardware. Release date TBD – just keep an eye on my project repo on GitHub (linked in the article).
Second, I’ve been working on support for 3 phase using the same approach you’re looking for. I have very early alpha software available for testing and could use a few more testers that have access to 3-phase power. There are some limitations with this approach though, primarily surrounding the difference in voltage levels between the 3 phases. Since only one of them is being sampled, and difference in the voltage levels between the 3 phases will render itself as a small inaccuracy in the Real Power calculation. Also, a couple metrics like power factor and apparent power simply can’t be calculated for the phases that we don’t collect voltage samples for.
If you’d like to assist with testing, please submit a message through my website so we can connect over email. (Click on my name in this comment and it will take you to my website, then go to Contact).
Thank you David for your reply.
I look forward to your new version in C.
Re your request for support, I would of course love to help you out in any way I can. Before you raise your hopes up too high you should appreciate my limitations.
1. While I can get access to 3 phase it is not something I would be able to do overnight.
2. My reason for following your project was not simply to create a Power Monitor. As a virtual beginner in Python Programming I used your efforts to understand and then implement certain Python concepts of which you have many. For example besides sending numbers to screen I only store data in a .csv file. Graphing gets done in Excel.
What this means is that practically, replies from me may take long in coming and may not be up to your standards which are obviously much higher than mine.
Regards
joe
Super project that has been running seemlessly for 6 months now!
However, I want to integrate the grafana dashboard into Home Assistant so I need to remove the login requirements in the grafana config file.
I’m not familiar with Docker so I’m struggling to find the right file to edit.
Any help appreciated!
Without question, energy is getting more expensive and that trend is NOT expected to change. Add the tremendous inflation in the US (and likely other places) to the issue and the result is that we all must find ways to cut our spending.
I’m a Chemical Engineer specialized in controls. Rule #1: You can’t control or improve something unless you can accurately measure it. It’s very difficult to be more energy efficient if you don’t have a very good understanding of where your energy is being used. Not to mention, such information can also be leveraged to find problems in our systems. eg. Heat pump running a lot more than normal, using more energy? Maybe it’s low on freon? Is it really more efficient to run the dryer on a low heat setting (which takes longer to dry, running the motor much longer) or is it a “wash” in terms of energy? These are very important questions and will get more important as energy gets more expensive.
Rasberry PI offers so many possibilities in such an energy and cost efficient package, it’s an obvious starting point. I suggest combining electricity monitoring with water and natural gas monitoring as well. RTLAMR leverages a cheap USB radio receiver to receive consumption broadcasts from many utility meters, so that is an option for some of us as well.
My end-goal is to set up one Rasberry PI to monitor all of my utilities. Then use that data to convince my kids to take shorter showers and to defend my thermostat settings.