As mildly exotic silicon has become cheaper and the ingenuity of hardware hackers has been unleashed upon it, it’s inevitable that some once-unattainably expensive instruments will appear as cheap modules from China. The LTDZ spectrum analyser on the bench today covers 35 MHz to 4.4 GHz, and has a USB interface and tracking source. It has been available from all the usual outlets for a while now either as a bare PCB or in a metal box about the size of a pack of cards.
We’ve already taken a look at the $50 VNA, and this time it’s the turn of the $30 spectrum analyser, in the form of a little device that I succumbed to while browsing Banggood.
I ordered one, along with an attenuator and RF bridge for SWR measurements, and after the usual wait for postage my anonymous grey package arrived and it was time to give it a look and consider its usefulness. It’s a design derived from one published in Germany’s Funkamateur (“amateur radio”) magazine early in the last decade, and unscrewing the end plate to slide out the board from its extruded enclosure we can see what makes it tick.
How Much RF Test Equipment Hardware Does $30 Get you?
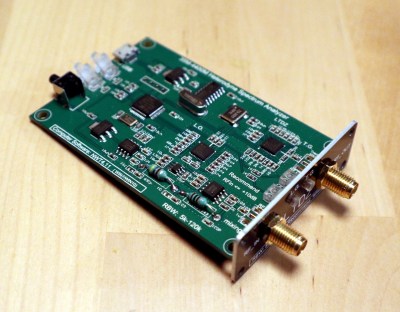 Its operation is surprisingly simple, in effect a very wideband radio receiver and signal source that can sequentially check signal levels across its range under the control of a microcomputer. On the board is an STM32F103 microcontroller that drives a pair of ADF4351 PLL frequency synthesisers for tracking and receive local oscillator respectively, an IAM-81008 receive mixer, and an AD8307 logarithmic amplifier to measure the received level. It’s reported as having a receive bandwidth in the region of 150 kHz, but I lack the instrumentation to measure that. On the rear edge of the board is a micro-USB socket, a couple of LEDs, and a “Key” switch to enable the tracking oscillator, and on the front are a pair of SMA sockets for RF input and output.
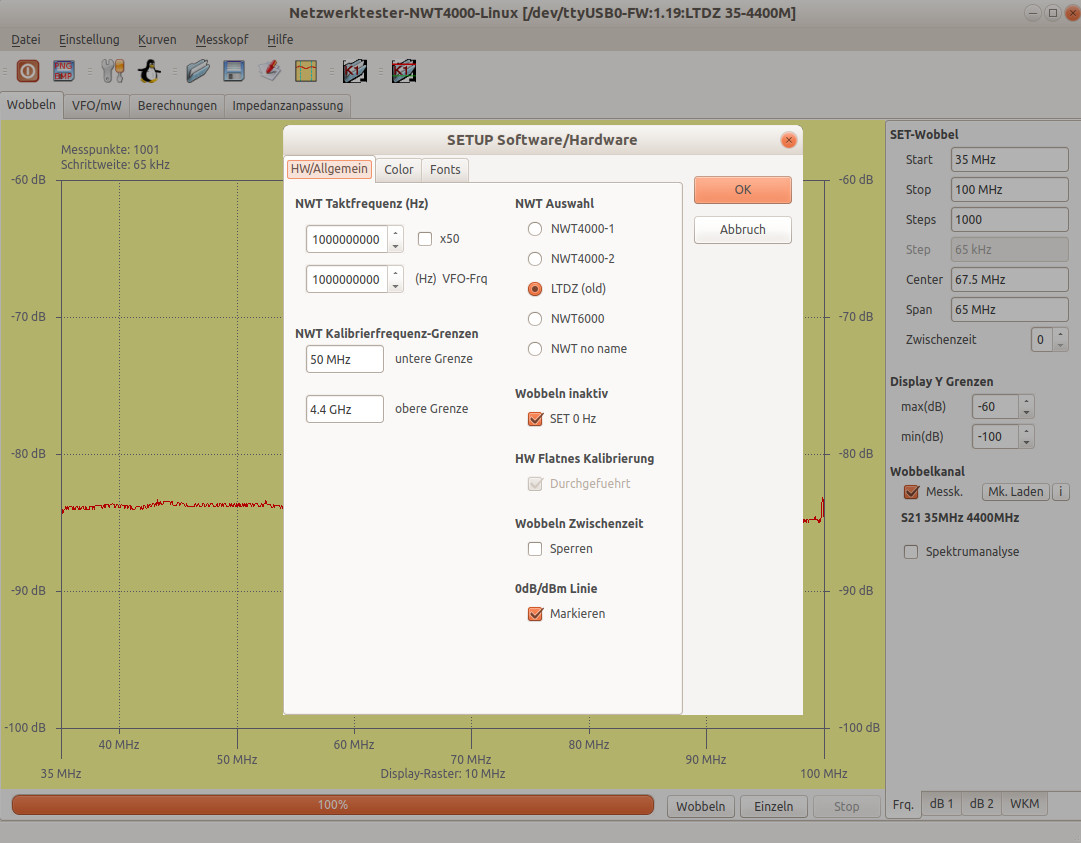
If you buy one of these you will almost certainly be offered a download from the vendor. In my case I couldn’t find a Linux version, and tried the NWT4000 software which worked with my spectrum analyser despite claims to the contrary. To respect his wishes we’ll not put a link to his website here, but if you use his software of whatever version on one of these units we would like to request that you do not trouble him for support. Happily the [DL4JAL] software isn’t the only game in town, with both VMA Simple Spectrum Analyser and SNA Sharp being readily available alternatives. They are however both Windows-only, and the former requires a paid activation key for long-term use.
When You Have A Spectrum Analyser, Everything Is An RF Source
Once I had my device plugged in and detected by the software, it was time to calibrate it. This process simply generates a record of the device’s performance while directly reading its tracking generator, allowing the software to create a flat baseline. Calibration involves running a scan first with tracking source connected to the input through an attenuator, then directly. Once this has been done it is then possible to read a flat line across the frequency range without any test devices connected. To my shame, it took me a while to realise that pressing the “Key” button was necessary to enable the tracking generator.
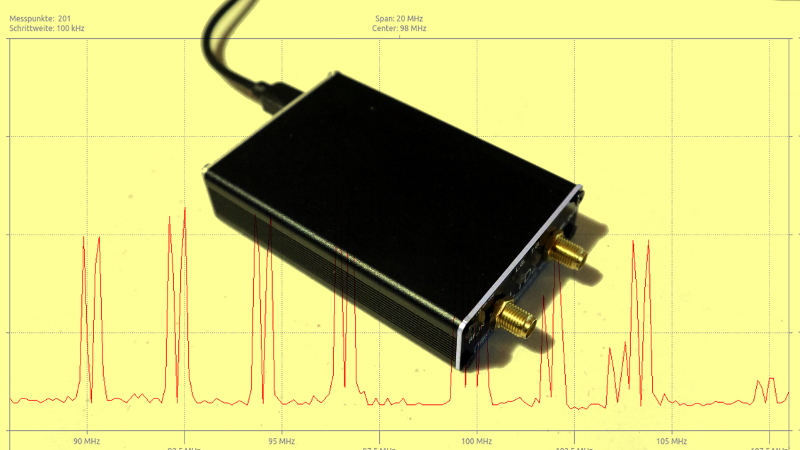
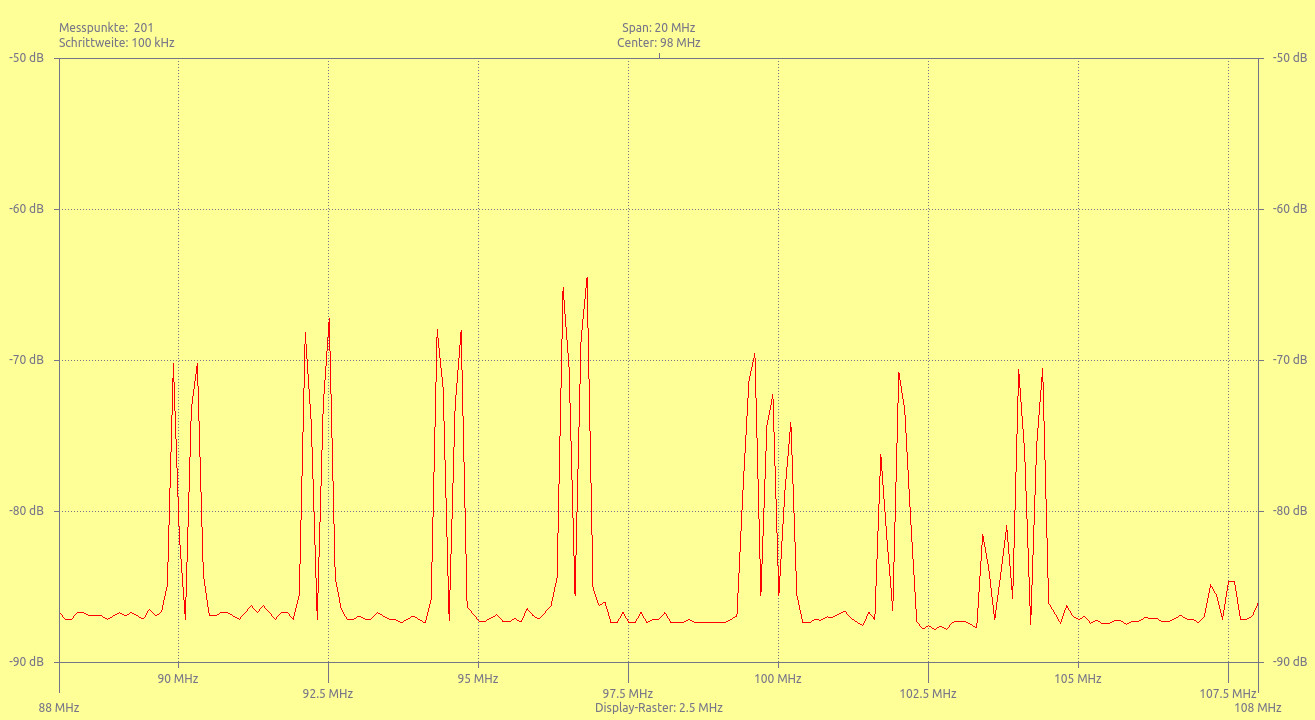
So, I have a spectrum analyser here on my bench, what next? Of course the first thing was to plug in an antenna and take a look at the off-air spectrum. I could home in on the FM band and see all the local stations that you’d find in a small British town, and I could see the TV multiplex transmissions, the home WiFi, and my mobile phone when I made a call. Having a new toy sends you scurrying around the house in search of radio sources, so I can confirm that variously a UHF remote, a DECT handset, and my Baofeng handheld radio all produce satisfying spikes on the graph.
It’s all very well to have a spectrum analyser to look at the pretty spikes, but it’s time to do something useful. The most obvious thing to try would be to characterise an antenna using the RF bridge, but sadly with most of my radio stuff in storage I don’t have a suitably narrow-band antenna to measure.
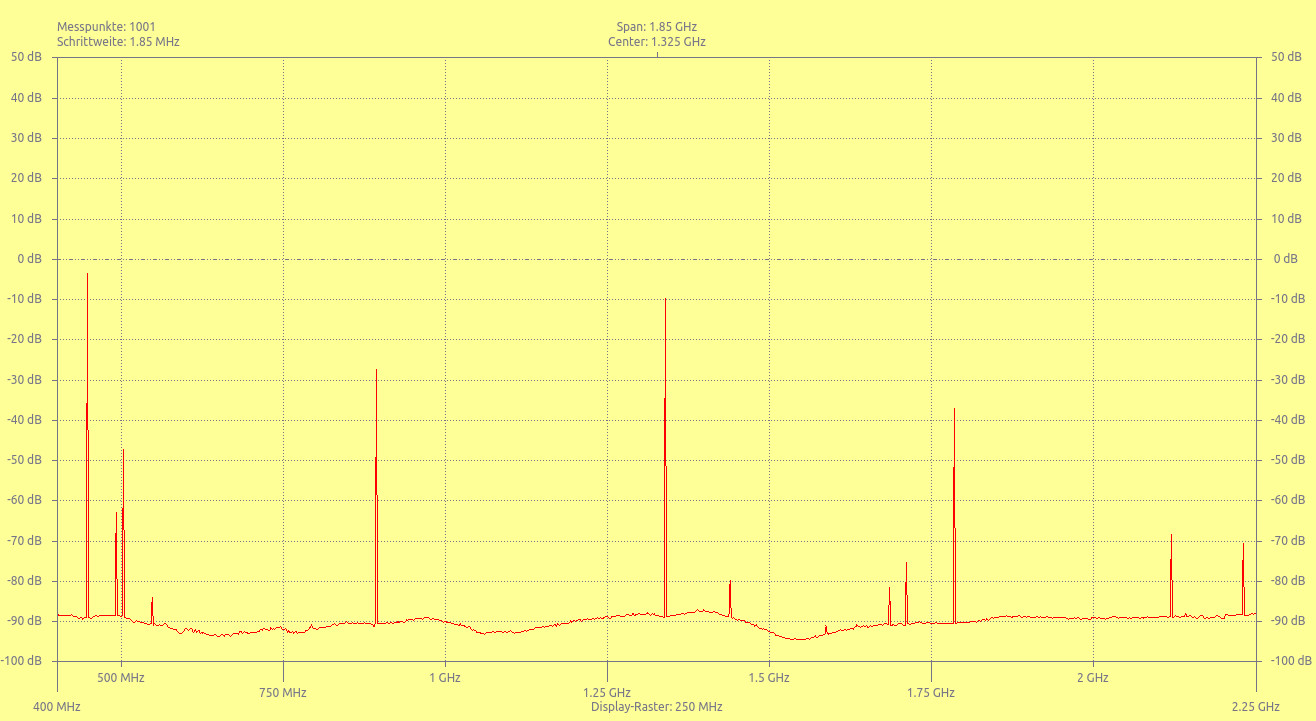
Instead I can check the spectral purity of my Baofeng transceiver, and for that all I need is the attenuator. The procedure is simple enough, connect the Baofeng’s antenna output through the attenuator to the spectrum analyser input, and take a spectrum reading. My back-of-the-envelope reckoning tells me that with the transmit power on the 100 mW “low” setting, the 20dB attenuator should be enough to reduce the level so as not to harm the analyser, and its input resistor should be capable of taking 100 mW for a short time. Setting it up in this way and pressing the transmit button, I could instantly see why there is some concern about the filtering on these cheaper radios. It has quite a few spurious spikes in the space between the 435 MHz fundamental and the first harmonic, then particularly strong subsequent harmonics. You get what you pay for in a transmitter.
So for $30, I seem to have picked up a useful little instrument that’s more than a toy and that can do some useful RF tasks on my bench. The $30 price tag makes itself felt though in that it has nowhere near the sensitivity and selectivity of its more expensive brethren, and its 35 MHz lower limit is too high for investigating noise emissions. Meanwhile the software has some availability issues over which we sympathise with its author, and we can’t help wishing that it had an open-source option available. For $30, it was worth it, but for much more I’d have to ask myself whether I would think the same. Perhaps for the lower frequencies in particular, a TinySA might be a better purchase.


The 4.4 GHz max is impressive, but at 150 KHz of bandwith, there’s not much worth looking at, in those higher bands.
A $20 RTL2832U based SDR, on the other hand, usually has a 1.76 GHz max, but with multiple MHz of bandwidth.
You are misunderstanding what this thing does and what that receive bandwidth (RBW) specification means. In the context of a spectrum analyzer the RBW is its spectral resolution. 150 kHz might match a broadcast FM channel OK, and can easily see (say) a 6 MHz TV broadcast channel, but 150 kHz is hopelessly wide to resolve individual voice channels in (say) the 2 m or 70 cm ham bands, which occupy only a few kHz and are spaced a few kHz apart: they would be all smeared together, impossible to resolve.
It also means this hears all the noise in its 150 kHz RBW too: it’s relatively deaf to faint narrowband signals like voice channels. CW even worse, but that’s not where this generally plays anyway.
RBW = Resolution bandwidth in my book. :)
Yah, but use an RTL-SDR as a spectrum analyzer? How do you find the signal between all the artifacts?
What I want to know is where I can find an rf spectrum analyzer that can measure GHz in much higher frequencies. According to a page on NASA’s website – 5G wifi is 30GHz to 300 GHz. I’ve found other sources claiming so too (although when I go searching for it nowadays all I find are claims of 5G being under 4.5 GHz.). But the thing is, a few doctors are saying that the effects they’re seeing from Covid also seem to be the very effects you would see from radiation damage.
A 30 GHz to 300 GHz range is huge of a difference. Military uses 94 GHz in their crowd control ADS devices which we find that yes, that is within the spectrum our routers are allowed to disperse. So the question is – where do I find a rf spectrum analyzer that can tell me if I’m being irradiated by a frequency that causes skin to burn?
You use a mixer on higher frequencies to get them to s usable band. It subtracts out a frequency and produces the usable band.
I’m curious, as an English resident, are you expected to pay licensing fees for a device like this, since it is an RF receiver or is it sufficiently different from a consumer radio or telly?
The law is (as ever) more opaque than this: https://www.legislation.gov.uk/ukpga/2003/21/part/4?timeline=false
My summary (IANAL!): If you are not intending (ie: knowingly) to receive & watch television via a piece of technology (electronics and/or software), then you are not breaking the law by owning or using it (cf: this summary https://www.tvlicensing.co.uk/about/legislation-and-policy-AB9).
Radios aren’t covered by such licensing, just televisions – and I think you could very easily argue this isn’t a television.
No, not even televisions. The law is straightforward, you need a license to WATCH broadcast TV, not for a device capable of receiving it. You can own as much equipment capable of receiving TV as you like. You only need a license if you use it to watch or record broadcast TV.
Take care of input level, it is very easy to damage it, and even with attenuator I was able to destroy mine without knowing how.
The whole WinNWT/LinNWT is another concern, basically it was released as GPL (as it use QT without licencing), then all versions withdrawn, I do not know if it was still under GPL then, but it’s cleary not glorious for the opensource movement.
The GPL says that, if someone chooses to distribute the software, the code must be available for someone interested to get.
The author is, at every moment, the copyright owner, and can stop distributing the software if he so chooses. Then, he is not required to make the code available anymore.
Although they’d be violating the GPL if they had distributed binaries with no source that included GPL code that wasn’t theirs.
And there’s no retroactively altering a license agreement you received something with. (Unless it was part of the license? IANAL)
Frankly, I don’t know that this is part of any movement. It’s a nice bit of legal agreement to allow others to share your work that people tend to violate.
For similar shenanigans see people who rage about violating their copyright on un-copyrightable materials.
Jenny: I think it unlikely you have several pairs of FM stations, each spaced 400 kHz apart, as the picture shows. I’m guessing each doublet there is a single station.
I just tried replicating that with my tinySA, but it does not show the effect.
Is this some weird artefact of the sweep? Would it go away if (for example) you reduced the step size to 50 kHz?
I just presumed those lobes were the FM sidebands. But now that you mention it, they’re waaaay too wide apart at this scale.
Strange clustering, but plausible?
I assumed they were the FM sidebands, aren’t they?
Or is it an image rejection thing?
You’d only get sidebands like that if you are modulating with a continuous tone or something, and the spacing (as Elliot says) is way too wide.
But you tell us: how many radio stations do you hear there on a plan old radio, and what are their actual frequencies?
Andries Spies did a review of the spectrum analyzer: https://www.youtube.com/watch?v=PRsaGEk-EsQ
I decided to invest in the TinySA and recently the NanoVNA aluminum enclosure that unfortunately for now was the last in stock… so no all metal case for the NanoVNA.
The pricing on the aluminum enclosure, being almost as much as the NanoVNA, re-fueled my CNC mill build or mini-lathe upgrade goal tasks moving forward another step… though also seems like will make an even better lost PLA mold and casting project.
When life won’t give you lemons, grow your own damn lemon tree!
The 150 kHz bandwidth makes it fairly useless for most things that I’ve used a spec-an for in the past. You can’t (as noted) resolve narrowband FM. You can barely resolve commercial FM stations, which have a 100kHz spacing.
It would be nice if it could resolve a kilohertz or less, and if it were capable of looking at the 1st IF of a ham transceiver, for example. Then you could track nearby signals. But I guess most modern transceivers have that built-in, these days.
That resolution really sucks, but its wide operational range is kinda nice to probe around when you don’t know where in the spectrum something is transmitting, somewhere. I use something similar when doing search-and-rescue work, I have an antenna array mounted to the belly of a fiber-glass motor glider. I’ve found more than a few people by picking up the spikes from transmissions from walkie-talkies or their cell phone crying out for a tower when they aren’t carrying a proper emergency beacon (Seriously kiddos, beacons aren’t that expensive to rent or buy, and they’ll make everyone’s lives much easier).
At $30, its not a big deal if you lose it or break it, and works quite well to find signals, but you don’t care about the content of those signals.
” I use something similar when doing search-and-rescue work, I have an antenna array mounted to the belly of a fiber-glass motor glider”
Do you use a comercial solution, or you own one?
Anyway, kudos to what you do.
For hobbyists, “spectrum analyzer” seems to break into four categories.
“Panadaptors” that attach to an existing receiver, and gives a visual representatiin of the signal you’re listening to, and a slice above and below that frequency. A gadget, but sometimes handy. About 1972, Ham Radio magazine had a very fancy standalone unit, showing five full hambands at a time, so so five front ends voltage tuned by a ramp, sequenced fast enough into one IF and then displayed on a tv set modified as a simple oscilloscope.
When varactor tuned tv tuners became available as surplus, there were lots of projects for “spectrum analyzers” that amounted to radio scanners with a visual display. Many used broad IF filters, and no real sense of logarithmic display, though some tried to be better. For many, it was cool, and if they had a practicaluse, it was finding signals.
But some tried to build real spectrum analyzers, albeit with limitations like limitedfrequency range. But they had proper logarithmic detectors, and put some effort into narrow IFs, so they could actually be test equipment, and analyze the output of a single transmitter.
Wayne Ryder had one of these in the June 1977 issue of Ham Radio magazine. It shows a full construction article (no exotic ICs), but always seemed like a goid explanation of a spectrum analyzer, and the tradeoffs.
And the fourth category was the lucky people who had access to a commercial spectrum analyzer at work.
I’m not sure something like this, or the tinySA is much more than the scanner types. An SDR gives much of the same function in that regard. Actually an SDR has the potential to be pretty good, since the processing allows for real work.
An SDR _is_ really good for some things. The RTL-SDR USB sticks — everyone should have one. They have high self-noise, and only 8 bits of resolution, but you can see a whole heck of a lot with what they’ve got.
What they lack is a tracking generator, so if you want to look at a filter’s response, or whatever, then you don’t have a signal to sweep. Of course, you could build your own white noise source on the cheap, and then you’d be set.
Calibration and etc are then a simple matter of software.
Calibration is also pretty much a (non-simple) matter of having standards to calibrate against. Depending on your requirements those can be fairly easy (calibrate against known radio frequencies) or much more difficult (read: expensive or fiddly)
Some fun projects later than 1980, HackRF + Protopack, a couple YardSticks(or any with CC1101 chip, eBay like $20). Software from here on URH (Universal Radio Hacker), or GNUradio, Resource Hacker(lulz), gqrx, RFCrack.py (run with python 2 env) ConsolCowboys on YT, there’s also a few other fun ones RFPwn.py and RFJammer. Just have to due a bit of searching on GitHub.
Thanks for talking about SNASharp which is the software I developed.
Just a comment, it is not windows only software, it run very well under Linux or Mac with Mono virtual machine.
Here is the source file depot : https://github.com/DavidAlloza/SNASharp
Regards,
David, F4HTQ.
Thank you!
Can you provide a link. I do not see it.
A link for why ?
SNASharp binary, Mono virtual machine ?
Sorry, I don’t understand you ask a link to analyzer .
If this can help, I bought mine here :
https://fr.aliexpress.com/item/1005001335107476.html
The RBW doesn’t matter if you’re using a device like this for sweeping a filter for its response, right? For that, wouldn’t the frequency resolution matter most? Does anyone know what it is? Looking at the datasheet for the VCO shows that it’s a fractional N PLL type, so it really depends on a lot of design decisions how good the resolution will be.
Baofengs low setting is usually 1W, or 1000mW, not 100mW and the IAM-81008 is specified for +14dBm absolute maximum input, and it sure ain’t linear anymore there!
On my unit the marking next to the RF input SMA states “<=5dBm" whcih would be a sane power level for it's input and work well with the bare adf4351 tracking generator which goes up to +4dBm on a good day.
So it was over driven hard here and then gave us a bunch of spurious responses.
This device is commonly referred to as the “Chinese LTDZ Spectrum Analyzer”. While the LTDZ device can be used as a spectrum analyzer, but it is rather insensitive and unselective. When it comes to resolution bandwdth (RBW or Selectivity), one of the product pages for this device on AliExpress says [1]: “RBW: adjustable 10khz, 50khz, 100khz, 200khz, 500khz”.
Given these compromises and the existence of an RF tracking generator output, I think it would be better to call this device a Scalar Network Analyzer (SNA), which measures loss or gain magnitude only (e.g. Mag[S21]). This SNA device would be useful for making simple sweeps of coaxial cables, filters, amplifiers, etcetera. An SNA should not be confused wuth a Vector Network Analyzer (VNA) which measures loss or gain and reflection magnitude and phase (e.g. S21, S11 respectively).
Note: To measure return loss magnitude (e.g. Mag[S11]) with this SNA device you would need at-least one additional component, an RF directional coupler or reflection bridge. Also, for any type of RF measurements it would also be a good idea to have a bunch of other RF components on hand as well, such as an Open, Short, Load, and Thru (OSLT) calibration set [2], attenuators, adapters, some quality test cables, and an SMA tourque wrench.
In order to do any sort of meaningful sweeps with an SNA or VNA the software controlling the device must allow you to “calibrate-out or store-and-subtract” the characteristics of the test setup without the Device Under Test (DUT) connected or inserted. Before you spend money on these devices make sure this is supported.
If you need an inexpensive device that is more like a traditional spectrum analyzer (RF input only, no tracking generator out, better sensitivity and selectivity), there is a device that is commonly referred to as the “Chinese TinySA Spectrum Analyzer”.[3][4] The TinySA covers 0.1MHZ-960MHz.
* References:
1. Spectrum Analyzer USB 35-4400M Signal Source Power Meter RF Frequency Domain Black Analysis Tool Tracking Source Module $35.45.
https://www.aliexpress.com/item/1005001335107476.html
https://www.aliexpress.com/item/1005001953827117.html
2. Siglent F603FE – Female 4.5 SMA Type VNA Calibration Kit $439.00 (for lower frequency ranges you can make your own).
https://www.tequipment.net/Siglent/F603FE/Spectrum-Analyzer-Kits/
3. TinySA Is A $49 Spectrum Analyzer, by: Al Williams, September 1, 2020
https://hackaday.com/2020/09/01/tinysa-is-a-49-spectrum-analyzer/
4. Handheld Tiny Spectrum Analyzer TinySA MF/HF/VHF UHF Input for 0.1MHZ-350MHz UHF Input for 240MHz-960MHz Signal Generator $52.99.
https://www.aliexpress.com/item/1005001869873888.html
I am curious how how it compares to a more expensive analysers (let’s say a HackRF) when focussing on the sub GHz spectrum (for let’s say IoT communication analysis)..
Also rally cool to read that some older designs were used to create this device.