three sensory bridge audio spectrum analyzers, one in use with a lit LED array plugged in, the other facing the camera and leaning against the third, all on a table

The Sensory Bridge Is Your Path To A Desktop Rave

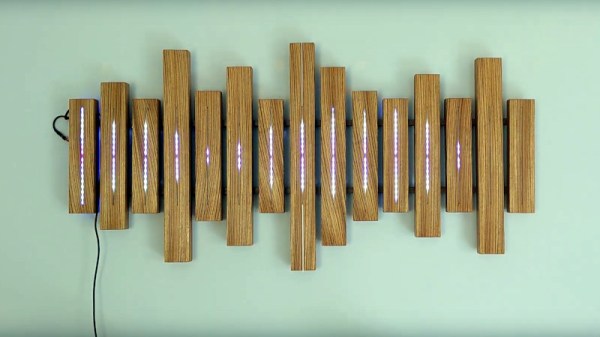
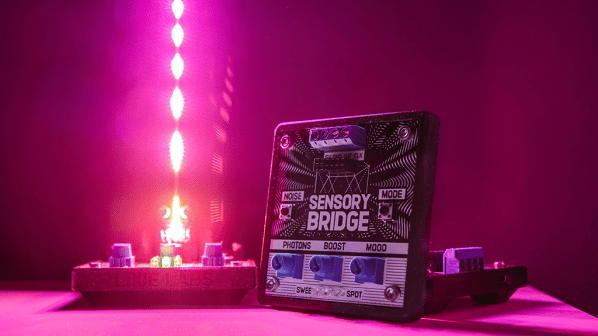
[Lixie Labs] are no strangers to creating many projects with LEDs or other displays. Now they’ve created a low latency music visualizer, called the Sensory Bridge, that creates gorgeous light shows from music.

The Sensory Bridge has the ability to update up to 128 RGB LEDs at 60 fps. The unit has an on-board MEMS microphone that picks up ambient music to produce the light show. The chip is an ESP32-S2 that does Fast Fourier Transform trickery to allow for real-time updates to the RGB array. The LED terminal supports the common WS2812B LED pinouts (5 V, GND, DATA). The Sensory Bridge also has an “accessory port” that can be used for hardware extensions, such as a base for their LED “Mini Mast”, a long RGB array PCB strip.

The unit is powered by a 5 V 2 A USB-C connector. Different knobs on the device adjust the brightness, microphone sensitivity and reactivity of the LED strip. One of the nicer features is its “noise calibration” that can record ambient sound and subtract off the background noise frequency components to give a cleaner music signal. The Sensory Bridge is still new and it looks like some of the features are yet to come, like WiFi communication, accessory port upgrades and 3.5 mm audio input to bypass the on-board microphone.

The stated goals of the Sensory Bridge are to provide an open, powerful and flexible platform. This can be seen with their commitment to releasing the project as open source hardware, providing firmware, PCB design files and even the case STLs under a libre/free license. Audio spectrum analyzers are a favorite of ours and we’ve seen many different iterations ranging from ones using Raspberry Pis to others use ESP32s.

Video after the break!

Continue reading “The Sensory Bridge Is Your Path To A Desktop Rave”

Woodworking, Blinkenlites, And FFT’s Dance To The Music

We all have that one project on our minds that we’d love to build if we could just find the right combination of time, energy, and knowledge to dive right in. For [Jonathan], that project was a sound sculpture that’s finally made it from concept to complete. [Jonathan] describes the sound sculpture as the culmination of a decade of learning, and in a moment you’ll understand why.

The sculpture itself is a beautiful display of woodwork mixed with what appear to be individually addressable LED’s. The varying length of the individual enclosures evokes the idea that the sculpture is somehow involved in the sound production, which is a nice touch.

An Adafruit microphone module feeds detected audio into a PSoC 5 microcontroller. You’d expect that [Jonathan] just used one of the FFT libraries that are available. But you’ll recall that this was the culmination of a decade of learning- why so? Because [Jonathan] went through the process of procuring his own grey hairs by writing his own FFT function. A homebrew FFT function and blinkenlites? What’s not to love!

You may also enjoy this discussion of Sine Waves, Square Waves, and FFT’s with our own Bil Herd.

Continue reading “Woodworking, Blinkenlites, And FFT’s Dance To The Music”

What Can A $30 USB Spectrum Analyser Do For Me?

As mildly exotic silicon has become cheaper and the ingenuity of hardware hackers has been unleashed upon it, it’s inevitable that some once-unattainably expensive instruments will appear as cheap modules from China. The LTDZ spectrum analyser on the bench today covers 35 MHz to 4.4 GHz, and has a USB interface and tracking source. It has been available from all the usual outlets for a while now either as a bare PCB or in a metal box about the size of a pack of cards.

We’ve already taken a look at the $50 VNA, and this time it’s the turn of the $30 spectrum analyser, in the form of a little device that I succumbed to while browsing Banggood.

I ordered one, along with an attenuator and RF bridge for SWR measurements, and after the usual wait for postage my anonymous grey package arrived and it was time to give it a look and consider its usefulness. It’s a design derived from one published in Germany’s Funkamateur (“amateur radio”) magazine early in the last decade, and unscrewing the end plate to slide out the board from its extruded enclosure we can see what makes it tick. Continue reading “What Can A $30 USB Spectrum Analyser Do For Me?”

Panadaptors Didn’t Start With SDRs

The must-have accessory on a modern all-singing, all-dancing amateur radio transceiver is a panadaptor. Inevitably driven by SDR technology, it’s a view of a band in the frequency domain, and it will usually be displayed as a “waterfall” giving a time dimension to see transmissions over a period.

[Bill Meara, N2CQR] reminds us that panadaptors are nothing new, indeed that they date back to the first half of the last century and don’t even need an SDR to work. And to prove it, he’s produced one for part of the 40-metre amateur band.

The principle behind an analogue panadaptor is simple enough, it’s a normal receiver whose local oscillator is given a linear periodic sweep over the desired frequency band and whose output drives the Y axis of an oscilloscope whose X axis is driven by the sweep. In [Bill]’s case the receiver is a BitX homebrew transceiver, and the swept local oscillator is provided by his Foeltech signal generator. A neat touch comes in the ‘scope being synchronised by triggering on a marker frequency at the bottom of the range being swept. He’s created a video showing it in action, which you can see below the break.

There are quite a few routes into making this type of simple spectrum analyser, indeed some of us have tried ti with TV tuners.

Continue reading “Panadaptors Didn’t Start With SDRs”

A Digital LCD Makeover For An Analogue CRT Spectrum Analyser

[Seb Holzapfel, VK2SEB] has a rather nice spectrum analyser, a Hewlett Packard 141T. It’s an entirely analogue instrument though, so it lacks some of the sophisticated features you might expect to see on its modern counterparts.

One feature the HP does have is a vertical deflection output that in effect allows the trace to be reproduced on an oscilloscope. [Seb] has taken that and applied it to an STM32F746 Discovery board with its associated LCD touchscreen to produce an interface for the HP that includes modern features such as trace normalisation and a waterfall view. Along the way he’s had to make a voltage level converter to render the HP’s scan output into a range acceptable for the ST board.

He goes into detail on his software for the project, which he is at pains to remind us is still very much a work in progress. He notes that the HP has a range of other outputs (on those “D” sockets that include co-axial connectors) that provide information about its band and scan settings, so there is ample possibility for further customisation.

If you are interested in this project then the code is all available via GitHub, otherwise you can watch his video below the break. He’s labelled it as “Part 1”, so we look forward to more on this project.

Continue reading “A Digital LCD Makeover For An Analogue CRT Spectrum Analyser”

Smartphone Bench Instrument Apps: Disappointment Or Delight?

If you are interested in electronics or engineering, you’ll have noticed a host of useful-sounding apps to help you in your design and build work. There are calculators, design aids, and somewhat intriguingly, apps that claim to offer an entire instrument on your phone. A few of them are produced to support external third-party USB instrument peripherals, but most of them claim to offer the functionality using just the hardware within the phone. Why buy an expensive oscilloscope, spectrum analyzer, or signal generator, when you can simply download one for free?

Those who celebrate Christmas somewhere with a British tradition are familiar with Christmas crackers and the oft-disappointing novelties they contain. Non-Brits are no doubt lost at this point… the crackers in question are a cardboard tube wrapped in shiny paper drawn tight over each end of it. The idea is that two people pull on the ends of the paper, and when it comes apart out drops a toy or novelty. It’s something like the prize in a Cracker Jack Box.

Engineering-oriented apps follow this cycle of hope and disappointment. But there are occasional exceptions. Let’s tour some of the good and the bad together, shall we?

Continue reading “Smartphone Bench Instrument Apps: Disappointment Or Delight?”

Ping Pong Spectrum Analyzer

A spectrum analyzer is a pretty useful tool for working with signals where the size of the frequency components matter. Usually, the display is a screen. Sometimes, you see it done with LEDs. [Mag Laboratories] did it with ping pong balls.

The device uses a processor to calculate a Fourier transform, cutting an audio signal into 16 frequency bands. The processor converts each of these values to a PWM output that drives small fans. The fans blow the ping pong ball up the tube proportional to the fan speed. You can see the result in the video below.

Continue reading “Ping Pong Spectrum Analyzer”