
If you dig microcontrollers, and you like to dig into how they work, Elecia White wants to help you navigate their innermost secrets with the help of memory map files. In this refreshingly funny, but very deep keynote talk from the 2021 Hackaday Remoticon, Elecia guides us through one of the most intimidating artifacts of compilation — a file that lists where everything is being put in the microcontroller’s memory — and points out landmarks that help to make it more navigable.
And when you need to look into the map file, you probably really need to look into the map file. When your embedded widget mysteriously stops working, memory problems are some of the usual suspects. Maybe you ran out of RAM or flash storage space, maybe you have some odd hard fault and you want to know what part of the program is causing the trouble, or maybe you need to do some speed profiling to make it all run faster. In all of these cases, you get an absolute memory address. What lives there? Look it up in the memory map!
Charting a Course
Elecia starts out with the map file from a “hello world” program, but it’s a hello world running on an RTOS, so already there’s enough meat to dig into. She starts out with the top-level overview: flash for the code and RAM for the program to use. In flash, the code lives in .text and .const, and RAM has sections that should be familiar to you like .heap and .stack, but also .data and .bss. The memory map file also follows this structure: first an overview, then the section markers, and then the details of what’s inside each section.
If you get a crash, for instance, and you know where the numerical value of program counter when it went all pear-shaped, the .text section lists the function name where that happened. The section with global variable definitions, listed alphabetically? You can probably just scroll on by that — there’s a lot of redundancy in the map file, sometimes sorted by memory address, sometimes sorted alphabetically. You don’t want to read a map file, you just want to dip in, get what you need, and get out. Got a variable that you think is getting overwritten? Find it in the section listed by address, and look at its neighbors — one of them might be overrunning.
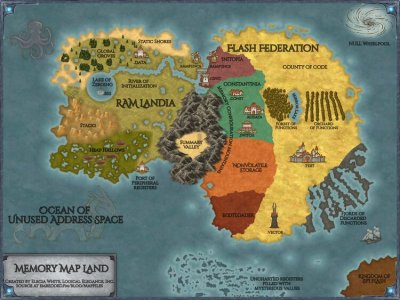 But the real star of the show is the beautiful map Elecia made in the style of a role-playing game. Across the River of Initialization from the Static Shores, you’ll find RAMlandia, the high planes of the Stacks, the low boggy Heap Hallows, and the Port of (memory mapped) Peripheral Registers. There are actually dragons in the Ocean of Unused Address Space. By switching back and forth between this fun, but useful, map and the actual text memory map file, Elecia ties a memorable view of memory with the dense text of the map file as it lives in your project folder.
And no talk about memory in microcontrollers is complete without noting the dangers of what happens when the RAM’s heap, which grows downwards, kisses the RAM’s stack, which grows upwards. What happens then? One more function call and the functions start overwriting your data. “This is fine. Like a dog sitting in a cafe on fire.” The problem is, this is the part of memory management that’s dynamic, functions call other functions and memory is allocated and cleared. User input changes which parts of the program run, and thus where data is stored. Here is the one place where the memory map won’t help you, except to find out what’s nearby where the crash happened. But the true answer to “How much RAM do I have now?” truly is ineffably “I dunno.”
If you’re new to embedded design, perhaps the first twenty minutes of the talk is for you, and even if you’re a hardened veteran, you’ll learn something from the later sections. I thoroughly enjoyed Elecia’s talk, and so will you. You can watch it embedded just below. Bring a copy of the slides along too.


Wonderful video Elliot.
I wish I could take credit. That was all Elecia!
Yes, however, you brought her here.. 5 stars.
I love old school paper CPU/Microcontroller documentation and paper listings of memory maps that span several pages long, sometimes dozens. It’s very practical and useful to have that on paper while working on a computer. I tend to print the PDF versions of such documents.
Yeah, but that’s just the memory-mapped peripherals. Where the code goes is the next level.
But agreed. I was at a talk about a new (to me) microcontroller at a hackerspace, and the speaker puts up the peripheral memory map and says “well, we’re done then.”
I’ve had to dig in to map files a few times, mainly to try and find/free some space.
There may be tools to allow you to do this in IDEs but I’ve regularly imported map files in to excel, converted the size of each function in flash to decimal from hex and sorted them descending. It’s allowed me to find the funcs with the most fat that can maybe refactored.
As I say, maybe there’s automated ways of doing this but none that I’m aware of.
The MBED-CLI tools produce a map file by default. And it does one better: it keeps the previous map file around to compare it with result of a new build. You get a section size comparison after each build :)
That map map is going to be my desktop background :)
Thanks Elecia for a great presentation.
Please make the video accessible without using proprietary youtube!