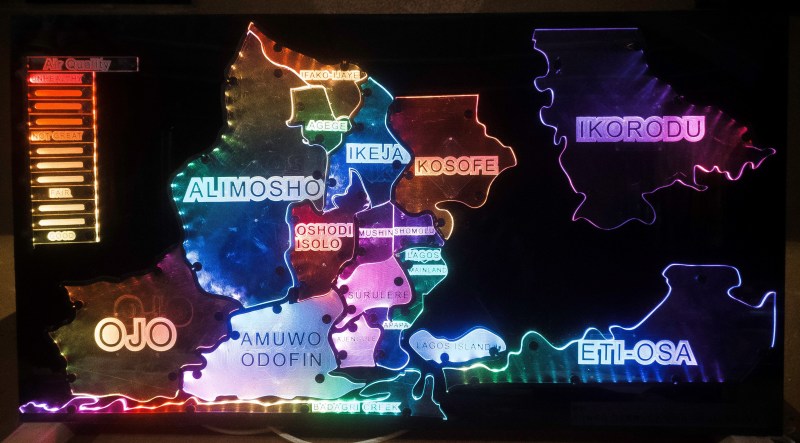
Air quality can have a big impact on your health, but it isn’t always something you can see. [Ahmed Oyenuga] wanted to make air quality something more tangible and developed an Interactive Air Quality Map.
Using addressable LEDs and acrylic panels, [Oyenuga]’s map lights up different regions of his state (Lagos) with colors that correspond to qualitative values of the air quality readings. The color key on the edge of the map becomes a readout when you touch a specific region of the map.
Most of the map’s functionality is handled by an Arduino WiFi 1010, but the capacitive touch is running on a custom board [Oyenuga] designed with an ATSAMD21J17. [Oyenuga] is getting air quality data via a DesignSpark Environmental Sensor Development Kit (ESDK) and then uses reverse geocoding to take the GPS data and turn it into a location the map will understand.
If you’re interested in different options for monitoring air quality that could feed into a map like this, why don’t you check out this LoRa Air Quality Monitor or even a Mobile Air Quality Monitor.


Neat idea! Neat execution!
I hope it inspires others around the world to monitor their locales, which in turn inform them of possible hazards that can be addressed.
It looks like an excellent movie prop