If you just want to use a debugger for your microcontroller project, you buy some hardware device, download the relevant driver software, and fire up GDB. But if you want to make a hardware debugger yourself, you need to understand the various target chips’ debugging protocols, and then you’re deep in the weeds. But never fear, Sean [Xobs] Cross has been working on a hardware debugger and is here to share his learnings about the ARM, RISC-V, and JTAG debugging protocols with us.
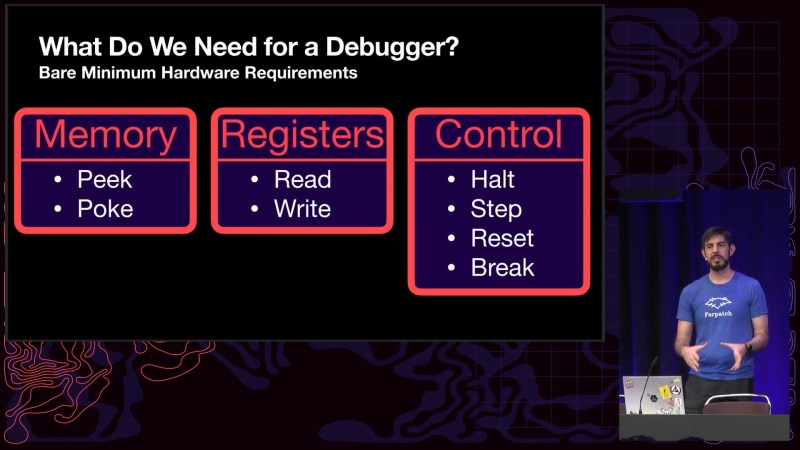
He starts off with a list of everything you need the debugger hardware to be able to do: peek and poke memory, read and write to the CPU registers, and control the CPU’s execution state. With that simple list of goals, he then goes through how to do it for each of the target chip families. We especially liked [Xobs]’s treatment of the JTAG state machine, which looks pretty complicated on paper, but in the end, you only need to get it in and out of the shift-dr and shift-ir states.
This is a deep talk for sure, but if you’re ever in the throes of building a microcontroller programmer or debugger, it provides a much-appreciated roadmap to doing so.
And once you’ve got your hardware setup, maybe it’s time to dig into GDB? We’ve got you covered.


Debugging with gcc c compiler sends this programmer back to 1960s methods … lots of prints, changers, and retries.
64 bit transparent portable multiply accurate to 128 bits appears to now work on x86 and ARM A53 platforms. $130 x86 and $21.99 ARM platforms. :)++
a[] =00000000:00000080 multiplicand
exponentofa = 0
b[] = 01000000:00000000 multiplier
exponentofb = 0
c[] = 01000000:00000000:00000000:00000000 jj=9 kk=7
c[] = 02000000:00000000:00000000:00000000 jj=10 kk=7
c[] = 04000000:00000000:00000000:00000000 jj=11 kk=7
c[] = 08000000:00000000:00000000:00000000 jj=16 kk=7
c[] = 10000000:00000000:00000000:00000000 jj=17 kk=7
c[] = 20000000:00000000:00000000:00000000 jj=18 kk=7
c[] = 40000000:00000000:00000000:00000000 jj=19 kk=7
c[] = 80000000:00000000:00000000:00000000 jj=48 kk=7
c[] = 00010000:00000000:00000000:00000000 jj=9 kk=6
…
c[] = 00000000:00000000:00000000:00000001 jj=9 kk=4
c[] = 00000000:00000000:00000000:00000002 jj=10 kk=4
c[] = 00000000:00000000:00000000:00000004 jj=11 kk=4
c[] = 00000000:00000000:00000000:00000008 jj=16 kk=4
c[] = 00000000:00000000:00000000:00000010 jj=17 kk=4
c[] = 00000000:00000000:00000000:00000020 jj=18 kk=4
c[] = 00000000:00000000:00000000:00000040 jj=19 kk=4
c[] = 00000000:00000000:00000000:00000080 jj=48 kk=4
Print at start of each shift.
Bugs in NVIDIA, Intel, AMD, … floating point hardware?
Do you come up with this gibberish on your own or are you torturing a poor AI to do it?
The JTAG details are more “common JTAG software debugging” vs “JTAG in general” – as in, most manufacturers cheap out and generically implement it similar. The instructions aren’t standardized except for a few pin testing functions. There’s no reason you couldn’t have separate “read data” and “write data” instructions, etc.
Obviously this is about program debugging, but JTAG can be handy for system (OS) debugging, too. If you can load an application, you can load files, too. Data transfer over JTAG isn’t that bad, like a good fraction of a MB/s in some cases.
ARM cores actually can have an integrated UART like port (called the DCC) which is stupidly useful, but Linux seems strangely paranoid about it (throws up big “do not use for production” warnings if you try to make it functional? Dunno why?). You could actually have 1 UART per core (!!) which would be amazingly handy, but the driver is definitely not structured for that, sadly.
I have a design where I realized very late I wouldn’t have a Linux serial console easy or any way to transfer data in worst-case scenarios, so I ended up using JTAG for both (JTAG console: sucks. JTAG bulk file transfer: surprisingly OK).