
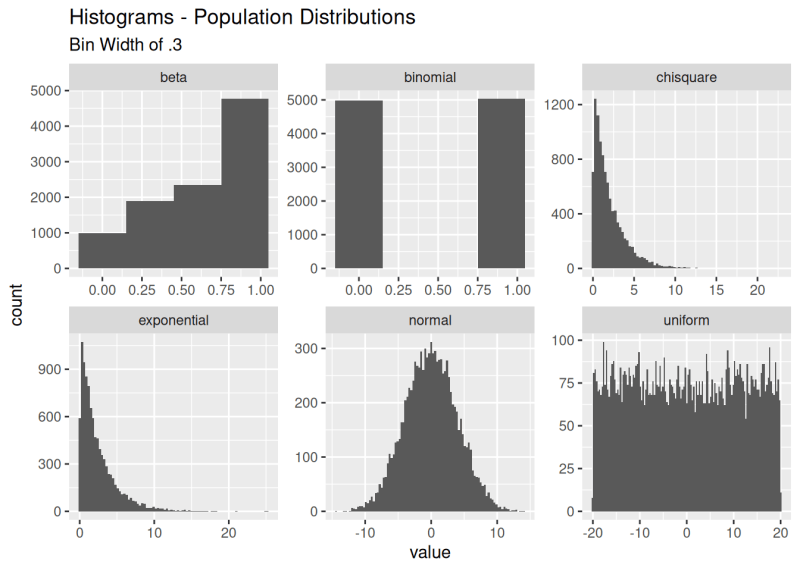
Statistics is one of those fields which people tend to love or hate when they’re confronted with it during their school time. Although incredibly useful and even essential in many fields, including finance and engineering, it’s not always easy to grasp even the basics such as those pertaining to distributions. The Central Limit Theorem (CLT) is an essential element there, which [Greg Foletta] tried to make easier to comprehend using some code samples and visualizations.
The essential summary of the CLT is that if you take the mean of each sample in a set, once you have enough (>30) samples, the distribution of the sample means approaches a normal distribution. This is quite the theorem to put out there, with the supporting proof and explanations on e.g. Wikipedia being very mathematics-heavy.
We’d be remiss not to also mention the excellent [3Blue1Brown] video on the topic, which has even snazzier visualizations if you’re more into learning in that fashion. Even if you don’t think that you need to learn statistics and how distributions work, chances are that you’ll come across a situation where it could have come in handy, or at least have deepened your understanding of a topic like the probability of something happening.












Please be kind and respectful to help make the comments section excellent. (Comment Policy)