If you’re completely landlocked like I am, you may dream of ocean waves lapping at the shore, but you probably don’t think much about the tides. The movement of the ocean tides is actually quite important to many groups of people, from fishermen to surfers to coastal zone engineers. The behavior of the tides over time is helpful data for those who study world climate change.
Early tide prediction was based on observed changes in relation to the phases of the Moon. These days, tide-predicting is done quickly and with digital computers. But the first purpose-built machines were slow yet accurate analog computation devices that, as they were developed, could account for increasing numbers of tidal constituents, which represent the changes in the positions of tide-generating astronomical bodies. One of these calculating marvels even saved the Allies’ invasion of Normandy—or D-Day— in World War II.
What Are Tides, Exactly?
In Sir Isaac Newton’s classic scientific trilogy Principia, he lays out the idea that the glue of the universe is in the gravitational pull of the bodies that comprise it. Newton proposes that the ocean tides of Earth are governed by the gravitational pull of the Moon, and to a lesser extent due to distance, the Sun. The Moon’s gravitational pull causes a peak in the ocean water nearest it. There is a peak of equal magnitude on the opposite side of the globe because inertia counteracts gravity. These peaks in the ocean bodies are called tidal bulges.
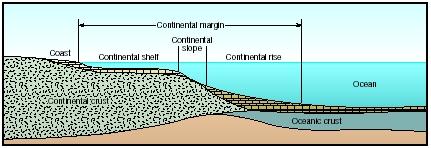
What Newton didn’t account for is the effect of the continents on tidal behavior. The distance between the low and high tide marks of any given shore is called the tidal range. Underneath every shoreline, there is a range of ocean floor where the ocean crust meets the continental crust. This graduation is called the continental margin. Wherever wide continental margins are found, the tidal bulges tend to produce higher tides. In contrast, islands located far from these continental margins tend to have small tides. Shallow water estuaries can distort the tide and cause it to rise faster.
Tidal behavior is influenced by many other factors, including local weather patterns. Winds out at sea can pull the tide out further, while inland winds can exaggerate tidal heights. A shore’s proximity to the Earth’s poles increases the tidal range.
Seaside Obstacle Course
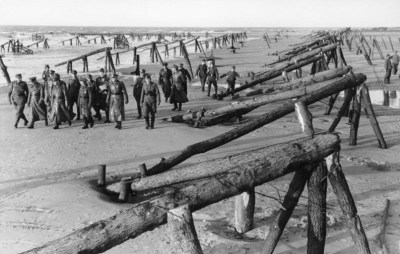
Planning the invasion of Normandy was no walk in the park for the Allied forces. The tidal range in this area of Nazi-occupied France exceeded six meters, and the tide rose at a rate of over one meter per hour. This meant there was a whole lot of beach to cross if the Allies made landfall at low tide. The Germans were well aware of the value of tide tables, and they were sure the Allies would arrive at high tide. Under the command of German Field Marshal Erwin Rommel, they constructed thousands of large obstacles along the beach. They built the obstacles about halfway up the tidal range so that they would be obscured at mid-tide and covered completely by high tide. The intent of this part of what Hitler dubbed the “Atlantic wall” was to destroy the undercarriages of Allied boats, should they arrive at high tide as expected.
Here’s the thing about building millions of obstacles on the beach, though: they can be seen quite plainly when the tide is out, especially from the sky. In fact, the Allies watched them multiply like rabbits over a couple of months in the early spring of 1944. Rommel was sure the boats would arrive at high tide, but the Allies now knew that it was out of the question.
Hand-Cranked Tidal Calculators
French mathematician and physicist Pierre-Simon Laplace built upon Newton’s tidal theories. He derived equations that described the way the oceans move in accordance with the gravitational pull of the Moon and Sun, and figured out that all tidal energy is focused at a small number of frequencies. Laplace’s equations, which are built on the conservation principles of mass and momentum, calculate the energy at each of these astronomical frequencies. He believed that these calculations were the best way to accurately predict the tides.
Laplace’s hydrodynamic approach to tide prediction was first put into use by William Thomson, who would later become Lord Kelvin. The thrust of Thomson’s harmonic method was to collect tidal data and analyze the frequencies using Laplace’s equations. While effective, this method involved a great deal of laborious calculations that could be performed far more quickly by mechanical means.
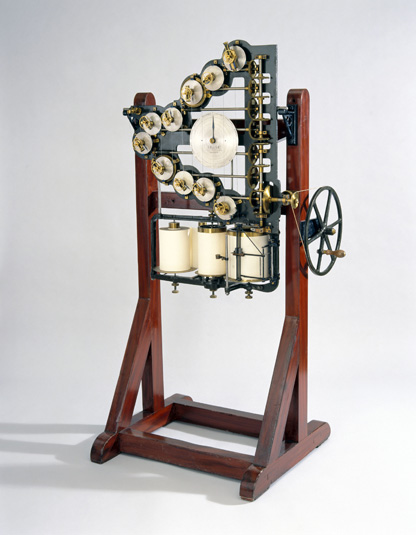
Thomson created an analog computer to plot the tidal motions on a continuous graph that illustrates tidal heights over a period of time. The device was operated by hand crank. Turning the crank drove pairs of toothed disks, each representing a tidal constituent such as the lunar semi-diurnal period of twelve hours and twenty-five minutes. The ratio of a given disk pair determined the speed at which the upper disk moved.
This movement was transferred to a wheel through a rod connected to both. At the disk end, the rod is connected to one of a number of pins. The position of the pin determines the phase and amplitude of the tidal component. All of the components are tied together by a common band that sums them together, and this system converts the rotary motion of the disks into the sinusoidal motion exhibited by the pen on the graph.
Later known as Kelvin’s tide machine (you just have to love that name), this device could predict a year’s worth of tidal data in about four hours. His first iteration could sum ten tidal components. Kelvin ultimately made three versions of increasing complexity, the last of which summed 24 components.
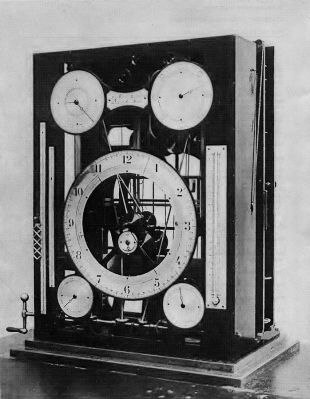
At about the same time, William Ferrel was constructing a similar machine for the U.S. Coast and Geodetic Survey. Ferrel’s tide predictor accounted for 19 different tidal components. It worked a bit differently from Thomson’s machine, though. Instead of graphing a curve, a series of dials and scales displayed the times and heights of successive periods of high and low water. The operator cranked it with one hand from the left side and took down the results. These numbers were copied to forms and used to create tide tables for general marine navigation. Ferrel’s machine was in use from the early 1880s until 1910. It was replaced by the U.S. Tide Predicting Machine No. 2, which was capable of summing 37 tidal components. This machine, a.k.a. “Old Brass Brains” (again, amazing name for a computing device) spent 55 years in service before being replaced by a computer.
D-Day
While it’s true that these machines could predict a year’s worth of tidal activity in an afternoon, harmonic analysis of the data took several weeks to complete. After entering WWII the U.S. military made several successful amphibious landings in the Pacific and elsewhere based on the news from Old Brass Brains.
In England, tide prediction was handled by Arthur Thomas Doodson from the Liverpool Tidal Institute. It was Doodson who made the tidal predictions for the Allied invasion at Normandy. Doodson needed access to local tide data, but the British only had information for the nearby ports. Factors like the shallow water effect and local weather impact on tidal behavior made it impossible to interpolate for the landing sites based on the port data. The shallow water effect could really throw off the schedule for demolishing the obstacles if the tide rose too quickly.
Secret British reconnaissance teams covertly collected shallow water data at the enemy beaches and sent it to Doodson for analysis. To further complicate things, the operatives couldn’t just tell Doodson that the invasion was planned for the beaches of Normandy. So he had to figure it out from the harmonic constants sent to him by William Ian Farquharson, superintendent of tides at the Hydrographic Office of the Royal Navy. He did so using the third iteration of Kelvin’s predictor along with another machine. These were kept in separate rooms lest they be taken out by the same bomb.
After the Allies discovered the Atlantic wall obstacles in the early spring of 1944, the mission had to be re-evaluated. The new plan? Make landfall just after low tide, and send demolition teams to blow up obstacles, creating safe channels. This way, the larger crafts could come in as the tide rose, drop troops off, and get back out to sea.
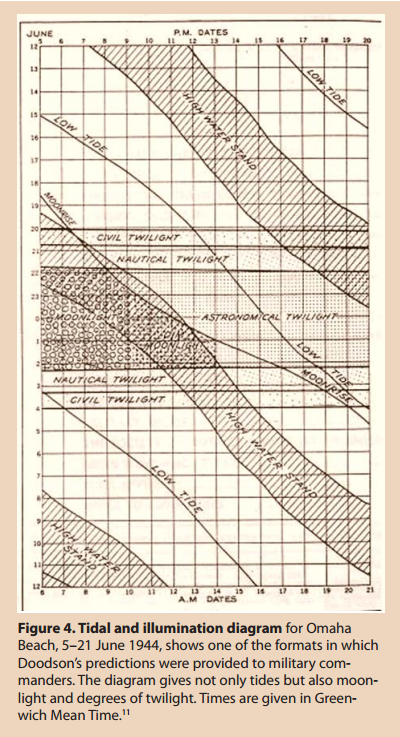
The plan was further complicated by the beach locations along the English Channel, which they pretty much had to cross at night. The Allies needed to figure out when low tide would line up with first light and a late-rising Moon. Three days in June 1944 fit the bill perfectly: the 5th, 6th, and 7th.
Under the Weather
Although General Eisenhower chose June 5th for D-Day, the weather just wasn’t cooperating. It was simply too windy to make the landing work. Fortunately, his staff predicted a break in the weather that made June 6th a real possibility. Rommel figured the weather and unfavorable tides would deter the Allies completely, so he greatly reduced his forces with the exception of Omaha Beach and left his post. The rest, as they say, is history.
[Main image: U.S. Tide-Predicting Machine No. 2 via NOAA]


Very cool article. Thank you!
Fun Fact: The moon does not pull the water in to the bulge but the pull of the moon pushes the water in to the bulge.
That is why there is no tide in lakes and coastlines have such an impact on tides.
https://youtu.be/pwChk4S99i4
Agreed, I was going to post the same comment and YouTube clip.
Fascinating! I’d love to see a video of these machines in operation. The article a few months back of the mechanical Fourier series calculator made me drool.
Also the tidal recon commando stuff sounds like something ripped out of Cryptonomicon’s Sgt. Shaftoe storyline
I wouldn’t be surprised if Neal Stephenson had heard about the beach recon units and took elements of it for Cryptonomicon, but there’s an article with some amount more information here:
http://www.theguardian.com/world/2011/may/30/secret-d-day-advance-unit-memorial
Neat article!
I can’t remember the exact quote from Cryptonomicon, but where Shaftoe is getting ready to ram the boat into Norway, there’s a passage that says “Shaftoe had the distinct feeling that this was Waterhouse’s idea”
Now get out there and dip those stencils in green paint before we lose the war!
There ae a couple of videos of tide machines on YouTube try this one for starters:-
https://www.youtube.com/watch?v=AxC770lpSLw
I used to work at Bidston Observatory where Doodson had worked and had one his machines in the lobby. That one did 42 constants. We used to run it on open days. There is a picture of it here:-
http://www.ntslf.org/about-tides/doodson-machine
and some drawings of it here:-
https://historicsealevel.wordpress.com/tag/bidston/
it was mentioned on a BBC Coast programme
http://www.bbc.co.uk/programmes/b01jxxll
but I guess you need to have a UK IP address to watch and it will disappear shortly.
I tried your last link using a VPN set to an IP in the UK and it still says “not available”
Tesla’s article “The Moon rotation” (http://www.teslacollection.com/tesla_articles/1919/electrical_experimenter/nikola_tesla/the_moon_s_rotation) is quite a fascinating read for everyone looking to find little known, real facts of science, backed with experimental data.
Great article on recent history of Analog tidal devices, with the exception of a minor mistake and an omission.
Firstly an Omission, as you could also have included the Antikythera Mechanism ~205BCE: https://en.wikipedia.org/wiki/Antikythera_mechanism because as well as showing the positions of the known planets and predicting eclipses it would also have made a fairly good tidal predictor.
Secondly and perhaps more importantly, you cannot use Inertia as the explanation for the tidal bulge on the lunar away facing side of the Earth as that would result in a completely different time dependant declining tidal shape inconsistent with observation.
A more consistent explanation is that due to gravitational force falling proportionately as the inverse square of the distance between bodies, the side of the Earth facing the Moon feels a greater force than its centre, which feels a greater force than the rear side. This means that there is a tendency for the Earth to be stretched out of spherical along a line joining the centres of the two bodies.
Thus there is a tidal force, which the oceans because of their lower viscosity respond by motion towards and away to a greater extent than the ‘solid’ land. But, the land also deforms with an approximately 1 meter amplitude.
Now because the Earth is in fast rotation compared with the Moon’s orbit the Ocean tidal bulges are in motion but displaced sideways relative to the connecting line ahead of the Moon’s position in the sky on the Moon facing side. This results in an additional force vector that makes a very small transfer of angular momentum from the Earth’s spin to the Moon’s orbit, which is why over Millions of years the Earth has slowed its rotation and the Moon has moved farther away, as can be seen in the fossil record of ancient tidal reefs.
The above also is true to a lesser extent for the Sun Earth interaction and to a miniscule amount between the Earth and any other body in the solar system.
The Antikythera Mechanism article has already been written (also one of Kristina’s works) and will be included in the upcoming second volume of the Hackaday Omnibus. It will be published on the blog once print edition is announced next month.
Thanks for the added color on tidal forces!
The tidal range in the Mediterranean sea is very small. The Greeks, despite getting to India didn’t venture into the Atlantic very often.
A diagram of the lunar gravity differential field at the earths surface illustrates your second point nicely: https://en.wikipedia.org/wiki/File:Field_tidal.svg
>>A shore’s proximity to the Earth’s poles increases the tidal range.
This is incorrect, or worded wrong. A cursory glance at the diagram in the article shows that the poles should have the smallest tidal ranges, all else being equal. Perhaps it was supposed to read
“A shore’s proximity to the Earth’s equator increases the tidal range”
It is not being closer to a pole that gives higher tides, but arrangement of the continents and local geography. Case in point Antarctica has tides so small they border on non-existent. Yet some of the highest tidal ranges are found in the comparatively crowded North Atlantic.
Tide-predicting machine video Parts 1 & 2
https://www.youtube.com/watch?v=ANOboDEFr7M
https://www.youtube.com/watch?v=AxC770lpSLw
Dude is awesome…
I love articles like this! Please keep them coming. :)