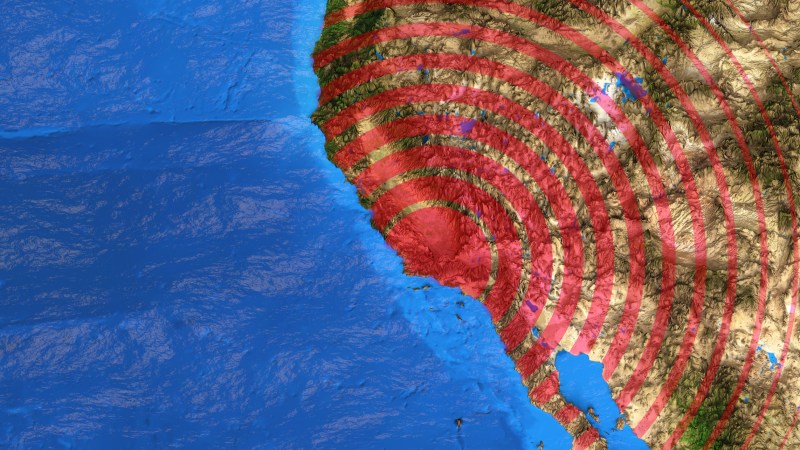
If your only exposure to seismologists at work is through film and television, you can be forgiven for thinking they still lay out rolls of paper to examine lines of ink under a magnifying glass. The reality is far more interesting in a field that has eagerly adopted all available technology. A dramatic demonstration of modern earthquake data gathering, processing, and visualization was Tweeted by @IRIS_EPO following a central California quake on July 4th, 2019. In this video can see the quake’s energy propagate across the continental United States in multiple waves of varying speed and intensity. The video is embedded below, but click through to the Twitter thread too as it has a lot more explanation.
The acronym IRIS EPO expands out to Incorporated Research Institutions for Seismology, Education and Public Outreach. We agree with their publicity mission; more people need to know how cool modern seismology is. By combining information from thousands of seismometers, we could see forces that we could not see from any individual location. IRIS makes seismic data available to researchers (or curious data science hackers) in a vast historical database or a real time data stream. Data compilations are presented in several different forms, this particular video is a GMV or Ground Motion Visualization. Significant events like the 4th of July earthquake get their own GMV page where we can see additional details, like the fact this visualization compiled data from 2,132 stations.
If this stirred up interest in seismology, you can join in the fun of networked seismic data. A simple seismograph can be built from quite humble components, but of course there are specially designed chips for the task as well.


That is a cool visualization!
(it is amazing that the tremors skipped Canada on their way to Alaska!) B^)
Canada is too polite to tremor, eh?
Sorry!
Old planets tremor. Get senile too.
Unlike James Bond neither shaken or stirred.
Yes love that movie
Cool. The network looks worth joining.
To HaD: The detection instrument is a seismometer. The recording instrument is a seismograph – if it plots something like motion, velocity, acceleration, or all three mixed depending on frequency, as in a forced oscillator. The actual event is an earthquake or seism.
I checked out the cheapest Raspberry Shake – $374.99 – $499.99! That is a hell of a profit margin for a RasPi ($20) and a geophone ($65) and some plastic.
That price is part of why I haven’t joined. That’s more of an academia price, and perhaps for the dedicated citizen scientist. But for someone who just wants to help add some data to the system? It’s a bit much to ask IMHO.
What’s going on at about the 6 second mark (a little after the first tick on the timeline in the video)? I see a pronounced but (relatively) weak wave propagating ahead of the peak one. Do I just not see it sooner because of the lower density of stations in the western US? Is it because there are waves traveling at different velocities and it takes that kind of distance for them the separate enough to stand out? Or is these something else going on?
That really faint stuff racing out ahead? Maybe it is P wave then S wave then L wave. Geophones are not great for this.
Another set of visualisations on the Ridgecrest earthquake.
https://drive.google.com/file/d/1nP00HxqmEHAbKno5yDKW0v1csFWBsnbU/view?usp=drivesdk
The full set: https://drive.google.com/folderview?id=1eRyuttach04iWH5rJkf_nAdw5o4UCxw9
More seriously, why are there SO MANY of those detectors in Alaska? I guess they have nothing better to do up there than bury seismology equipment in the frozen earth? :-D
It’s called the Transportable Array: http://www.usarray.org/Alaska
In short, it’s a system of hundreds of relocatable temporary seismic detectors. For the last couple decades, it’s been deployed in different areas of the united states, allowing scientists to study the seismic properties of those areas in much higher resolution. Once an area has been studied for a few years, they pick up the sensors and deploy them somewhere else.
Right now the transportable array is in Alaska. It will be removed next year and redeployed somewhere else.
Wow, super answer!
What’s causing the constant red in California? Did those devices break?
Because we have SO MANY earthquakes up here. You put sensors where the action is!
Anyone know what’s up with Oregon/Washington State? They’re still vibrating long after the main shockwave has past by.
The rest of the coast doesn’t seem to, and we’re missing data in Canada for comparison, but it looks to me like they just have noisy sensors up there?
I did wonder if it was general noise from the fault lines, with the sensors can picking up even the smallest tremor.
I’m wondering, how does a geophone detect if the first movement is up, or down?
It must be more than just a voice coil, maybe multiple coils?
They have a coil in oil for damping. Due to being stuck with interpretation methods that date back to original seismometer/seismograph pairs that had no gain, just coils and magnets at both ends, I think they are critically damped. The 2nd order DEQ for a damped forced oscillator shows that the output depends on frequency. Particularly, the phase changes so that the sensor magnitude represents displacement, velocity, or acceleration, depending on frequency.
So the simple answer is you can tell from the polarity, but you might have to integrate twice depending on frequency. One might hope that modern geophones and support gear are undamped or dynamically damped and use some DSP to just get displacement.
Comments not appearing under the prior comments they were replied too… still.
Ok, I thought that earthquakes appear locally and maybe spread a little bit in the surrounding area, but that they really “travel” through a whole country is interesting. The animation is really great.