A Simple Seismometer You Can Build Yourself

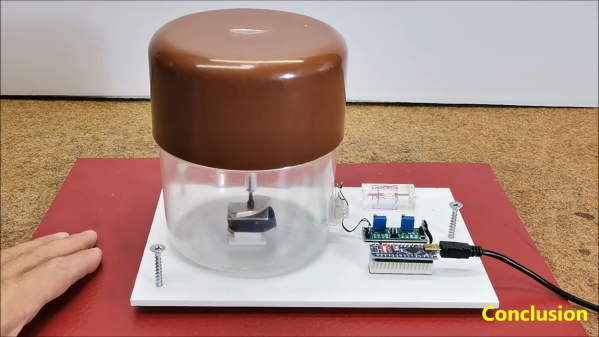
If you’re a child, there are certain things you’re taught even though they’re probably not directly relevant to your life. We teach young kids all about dinosaurs, and we teach older kids all about how the mitochondria is the powerhouse of the cell. We also teach kids about natural phenomena like earthquakes, and the equipment used to measure them. Namely, seismometers. You might like to satisfy your own child-like curiosity by building one of your own, like [mircemk] did.
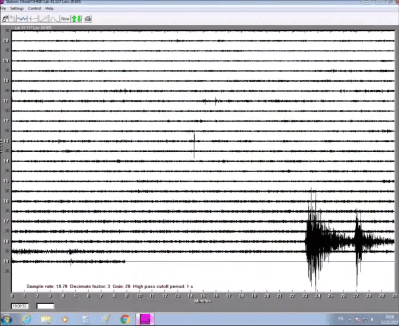
Output from the build showing tremors in the Earth.

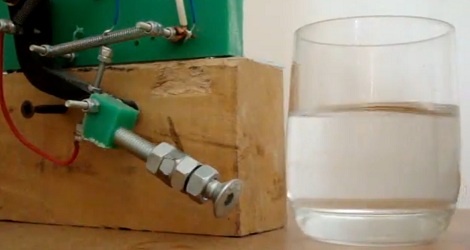
The build starts with a sensitive geophone of [mircemk’s] own design. That’s basically a microphone but it’s for picking up vibrations in the ground, not in the air. However, a geophone is not enough. You need to be able to pick up the signals from the geophone and then plot them if you want a seismometer.

First, the signals from the geophone must be amplified, which is achieved with a small circuit based around the LM358 op-amp. From there, the signal is sent to an Arduino where the output is captured via the analog-to-digital converter. This passes the signal to an attached PC which plots the results using a piece of software called NERdaq, which was developed for schools that built their own slinky-based seismometers.

[mircemk] reports that this setup has served as a reliable tool for visualizing earthquake activity for over 6 years. Though, it bears noting, it’s not calibrated so don’t expect to get science grade results out of it. Regardless, though, it’s a super cool way to understand more about what is going on with the geology around us. Video after the break.

Continue reading “A Simple Seismometer You Can Build Yourself”

Shake, Rattle, Roll, With Your Own Seismograph

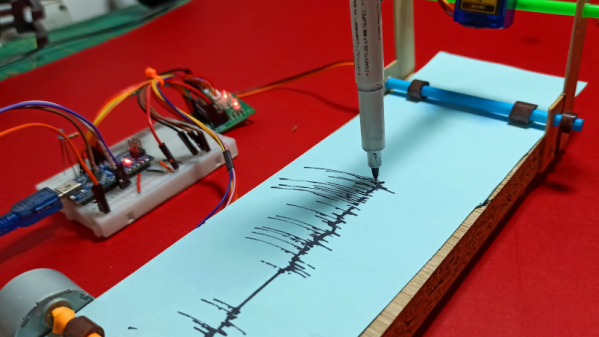
We always love to see projects where you can build your own lab equipment so [CompactDIY’s] homemade seismograph caught our eye. The design uses an Arduino with an accelerometer and builds on one of their earlier projects. You can see a video of the device below.

The principle is simple. A hobby servo controls a pen and a stepper motor rolls paper, creating a makeshift strip recorder. Its software uses the Visuino system, which is a flowchart-like system, but it outputs Arduino code. Honestly, we would probably have just plotted the data on a PC, but there’s a certain charm to the strip recorder and the idea would work for other types of data recording projects, too. We thought if you rearranged the stepper motor and cut a paper disk out, you could also have a circular chart recorder easily, which wouldn’t need to friction transport the paper. A clock motor would make it even less dependent on software, too.

If this project interests you, try a Raspberry shake, which isn’t as delicious as it sounds. Or, keep an eye on the entire globe, if you prefer.

Continue reading “Shake, Rattle, Roll, With Your Own Seismograph”

An Earthquake Display To Keep You Abreast Of Rumblings Worldwide

The Internet has brought us the ability to share data all over the globe, and nearly instantaneously at that. It’s revolutionized the sharing of science across the world, and taking advantage of this global data network is this earthquake display from [AndyGadget].

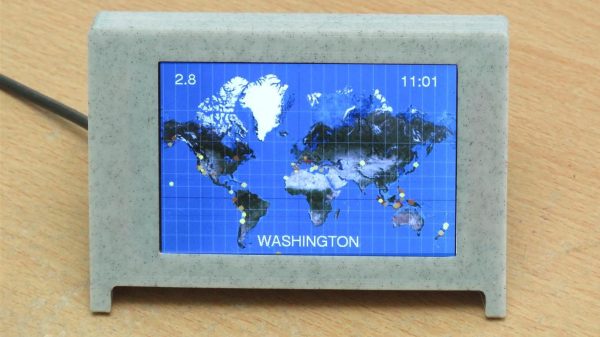
The build relies on an ESP32 fitted with an ILI9486 TFT display. The screen is in color and has a nice 480×320 resolution. This enables it to display a reasonably legible world map using the Web Mercator projection to fit the rectangular screen. The microcontroller then pulls in information from Seismic Portal, a site that aggregates data from seismographs and other sensors scattered all over the world.  Data from the site is pulled into the device live and overlaid on the world map, allowing the viewer to see the location of any current earthquakes at a glance.

It’s a great project, and one that we reckon would make a great addition to any university geology department. If it’s sparked an interest, consider diving deeper into the world of seismic analysis and data yourself!

Watch Earthquake Roll Across A Continent In Seismograph Visualization Video

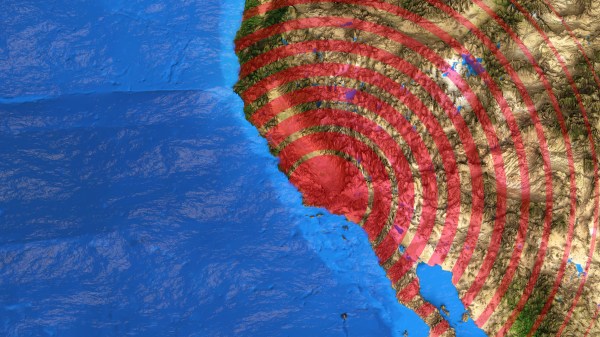
If your only exposure to seismologists at work is through film and television, you can be forgiven for thinking they still lay out rolls of paper to examine lines of ink under a magnifying glass. The reality is far more interesting in a field that has eagerly adopted all available technology. A dramatic demonstration of modern earthquake data gathering, processing, and visualization was Tweeted by @IRIS_EPO following a central California quake on July 4th, 2019. In this video can see the quake’s energy propagate across the continental United States in multiple waves of varying speed and intensity. The video is embedded below, but click through to the Twitter thread too as it has a lot more explanation.

The acronym IRIS EPO expands out to Incorporated Research Institutions for Seismology, Education and Public Outreach. We agree with their publicity mission; more people need to know how cool modern seismology is. By combining information from thousands of seismometers, we could see forces that we could not see from any individual location. IRIS makes seismic data available to researchers (or curious data science hackers) in a vast historical database or a real time data stream. Data compilations are presented in several different forms, this particular video is a GMV or Ground Motion Visualization. Significant events like the 4th of July earthquake get their own GMV page where we can see additional details, like the fact this visualization compiled data from 2,132 stations.

If this stirred up interest in seismology, you can join in the fun of networked seismic data. A simple seismograph can be built from quite humble components, but of course there are specially designed chips for the task as well.

Continue reading “Watch Earthquake Roll Across A Continent In Seismograph Visualization Video”

Raspberry Shake Detects Quakes

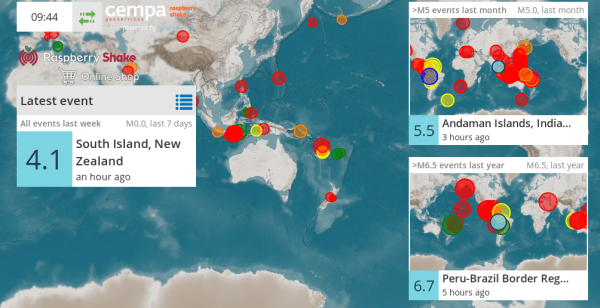
The Raspberry Pi’s goal, at least while it was being designed and built, was to promote computer science education by making it easier to access a working computer. What its low price tag also enabled was a revolution in distributed computing projects (among other things). One of those projects is the Raspberry Shake, a seismograph tool which can record nearby earthquakes.

Of course, the project just uses the Pi as a cost-effective computing solution. It runs custom software, but if you want to set up your own seismograph then you’ll also need some additional hardware. There are different versions of the Raspberry Shake, the simplest using a single Geophone which is a coil and magnet. Vibrations are detected by sensing the electric signal generated by the magnet moving within the coil of wire. Other models increase the count to three Geophones, or add in MEMS accelerometers, you can easily whip one of these up on your own bench.

The entire setup will fit nicely on a coffee table as well, making it much smaller (and cheaper) than a comparable professional seismograph. Once all of the Raspberry Shakes around the world were networked together, it gives an accurate, real-time view of seismic activity anywhere you can imagine. If you’ve ever been interested in geology or just want to see where the latest earthquake was, check out their projects. But you don’t need even a Raspberry Pi to see where the earthquakes are, thanks to a Hackaday Prize entry all you need is a Twitter account.

Thanks to [Rich Cochran] aka [AG6QR] for the tip!

Bicycle Seismograph Measures The Streets

Riding the streets of the Netherlands on a bicycle is a silky-smooth experience compared to doing the same on those of Germany. So says [Kati Hyyppä], who made the move with her trusty Dutch bike. The experience led her to record the uneven cobblestones and broken asphalt of the German roads on a home-made seismograph, a paper chart recorder driven by the bike’s motion and recorded upon by a pen free to vibrate as it passed over any bumps.

The resulting instrument is a wooden frame with a ballpoint pen mounted in a sliding holder weighted with some washers and kept under some tension with elastic bands. The paper roll is driven from the motion of the bike by the drive from a mechanical speedometer feeding a set of FischerTechnik gears, and the whole unit is suspended from the crossbar.

You can see it in action in the video below the break, and if you would like to build one yourself she has put the project up on Instructables as well as posting the description linked above.

Continue reading “Bicycle Seismograph Measures The Streets”

Earthquake Detector Could Have Helped During Quakepocalypse

[Andrea] built a seismic wave detector that warns of a possible impending earthquake. Because P waves travel much faster than the “make everything shake” S waves, building a device that detects P waves serves as an early warning system that alerts building occupants to go under a door frame. [Andrea]’s build detects these fast-moving P waves and only took an hour to make.

Last August, those of us on the east coast of the US had to live through Quakepocalypse, a magnitude 5.9 earthquake centered around Middle of Nowhere, Virginia. For those of us who have decided to stay, rebuild, and put our garden chairs upright again (so brave…), [Andrea]’s build could have been very useful.

The mechanics of the build is very simple: a pair of springs and levers are electrically wired together so that whenever there’s a sudden shock, a buzzer goes off. It’s very similar to an ancient Chinese earthquake detector that detects P waves by dropping a ball into a frog’s mouth.

While we’re not sure if a few of [Andrea]’s devices would be needed to detect P waves coming in off-axis, the build is simple enough to build dozens of them. Check out the video of the build in action after the break here.