With wearables still trying to solidify themselves in the consumer health space, there are a number of factors to consider to improve the reliability of such devices in monitoring biometrics. One of the most critical such parameters is the sampling rate. By careful selection of this figure, developers can minimize errors in the measurement, preserve power, and reduce costs spent on data storage. For this reason, [Brinnae Bent] and [Dr. Jessilyn Dunn] wanted to determine the optimal sampling rate for wrist-worn optical heart rate monitors. We’ve shared their earlier paper on analyzing the accuracy of consumer health devices, so they’ve done a lot of work in this space.
The results of their paper probably don’t surprise anyone. The lower the sampling rate, the lower the accuracy of the measurement, and the higher the sampling rate the more accurate the measurement when compared to the gold standard electrocardiogram. They also found that metrics such as root mean square of successive differences (RMSSD), used for calculating heart rate variability, requires sampling rates greater than 64 Hz, the nominal sampling rate of the wearable they were investigating and of other similar devices. That might suggest why your wearable is a bit iffy when monitoring your sleeping habits. They even released the source code for their heart rate variability analysis, so there’s a nice afternoon read if you were looking for one.
What really stood out to us about their work is how they thoroughly backed up their claims with data. Something crowdfunding campaigns could really learn from.


Nyquist-Hartley solved this. Sampling has to be twice the signal rate.
Mayo Clinic use (220-age). While this allows younger folks to have quite high rates thats probably not practical.
At roughly 70 my max is 150. I’ve seen that in recent years. That makes 300 hz the rate for me.
Hold on. Beats per minute is not the same as Hz.
Could you imagine having a heartbeat of 150 times per seconds? That would be wild!
Oooops…
It’s twice the highest frequency you want to measure, which may be much higher than the bpm of your pulse. In practice you probably want to sample at least 4 to 5 times the highest frequency to get a good signal. 2x is the theoretical minimum.
That 2x frequency only applies for sine waveforms (i.e. no higher harmonics). Think of it this way, you need at least 2 data points per period to fit a sine wave. It might not be enough if the waveform is a bit more complex.
You want a higher sampling rate to cover enough of the harmonics so that the waveform you captured is more recognizable.
Nyquist rate is for a sine wave. It does OK for a square wave, as long as you don’t care about the shape. But while the signal for the heartbeat is fairly slow, the shape of that signal does not have to be even or regular. That is probably why the need a sampling rate over an order of magnitude greater the signal they are measuring. 150 bpm is 2.5 Hz and they needed sampling greater than 64 Hz.
You need to take aliasing into account. If the signal you are interested in is accompanied by strong noise at higher frequencies, you will want to sample at a frequency that does not alias the noise onto the main signal (or use a lowpass filter that gets rid of the noise).
On the other hand if the main signal is narrow and there is no noise above or below it, you can use a lower sample rate that aliases the main signal to a lower frequency. See f.ex. drivers/media/pci/cx88/cx88-dsp.c in the Linux kernel for code that looks for pilot tones in analog tv broadcasts sampled at a low frequency. One problem I observed in this particular implementation is that frequency errors end up being multiplied by the number of times the signal is aliased.
The atrioventricular nerves in my heart stopped working earlier this year, and I had to get a pacemaker. Now my left ventricle beats later than my right, and my ventricles skip beats when my natural rhythm goes above 160bpm due to a configured limit.
The heart rate monitor that came with our schwinn exercise bike seems to work pretty well. On a sprint, it reads up to about 156 and holds there, and I feel skipped beats. If I keep pushing it, the meter reads above 160 and I have to take a break and sit down because my effective heart rate is then solidly in the low 80s. I’m just amazed it reports over 160 rather than only reporting my ventricular beat. It must either be sensitive enough to see the atrium beats, or filtered enough to assume it’s missing every other beat because heart rates don’t normally halve suddenly.
The $35 Chinese smart watch I got on the other hand is inaccurate enough to be useless. Might as well be a random number generator.
Before I got the pacemaker, once my natural ventricular heart rate dropped below 45bpm, none of the smart watches I tried could report an accurate number including an apple watch and a Fitbit. They both read around double and sometimes triple, so I assume they were assuming they were missing beats.
the general wearable ones seem close to useless, particular if you want you 02 reading as well.
However, you can get reasonable home clip on finger ones – I’ve tested mine compared to the machines at the hospital – that I was plugged into at the same time – and it was pretty good. The shame is can’t buy that one any more, so I can’t put up a link..
It depends on how much detail you wish to capture. For audio the CD frequency is 44.1kHz. At 22.050Hz it will capture two samples of the signal. If the signal is a sine wave it could mean it samples only at the zero crossing, making it look like there’s no signal at all, or at the top of the sine wave or anywhere in between giving different results depending on phase.
You want at least 4 samples per period so you can capture the zero crossing and the peaks. Phase shifts only move the signal to different amplitudes, but on average you’ve captured the essence of the signal bar the harmonics above the sample frequency.
If you want to capture the highest heart rate ever recorded, 480bpm, 8 beats per second, 8 Hz, I would choose 32Hz sample rate. If there’s a lot of noise in the system, which is to be expected given the weak signals involved, I’d sample 8x-16x more and average it by that amount. So 256 to 512Hz would give a solid signal depending on the sensor and pre-amplification and filtering.
I think the article is concluding that 16x may not be enough ie assume most people don’t want to measure greater than 180bpm, ie 3 per second. 16x is 48Hz samples – which in the summary they say is fine, but later (and I can’t read it as the pdf seems to have errors) say it may not be enough in some cases..
What most of the comments here are missing is that the signal being captured is far, far from a sine wave. It can be modeled as a narrow pulse, but there is more complexity than that. For many analyses, proper reconstruction of the waveform isn’t the point (this is a rate monitor application, not a diagnostic identifying particular pathologies), the sample rate needs to be sufficient to locate the edges with sufficient precision.
For basic rate monitoring, 2X is the minimum, but with no where near the needed information for the statistical analysis the authors were looking at. 16X was still insufficient for their purposes, as the variations they were looking at were smaller than the scale 1/8 of the period (Nyquist still applies, but time domain, not frequency domain)
Then again, I’m the guy that uses a 50 year old, 7 digit frequency counter to measure parts per 10^-10 differences between rubidium, cesium, and GPS timebases (for fun, because I have been working from home in lockdown for too long, now, and got curious if I could).
Interesting study, I spent a few years measuring heart rates using microwave radar, so I understand their challenges (we tried many techniques to get “ground truth”, including PPG, but really ECG cardio tach is the easiest). They could have benefited from consulting someone who understands time series analysis and modeling. I couldn’t figure it out, but it seems they quantized the measurement of inter-beat-interval to the decimated sampling rate, that is, their IBI must be an integer number of samples. This isn’t necessarily the best strategy, although it is simple to implement. While the PPG signal is far from a sine wave, it is quite regular, and some useful interpolation function would probably have allowed them to get a higher performance (i.e. if they were sampling at, say, 8 Hz, rather than 64 Hz, they could still come up with IBIs with higher precision than 125 milliseconds).
The other thing is that the study is limited, as they describe, to 5 minute test sessions, and with only one PPG sensor of limited capability for sample rates. A person designing a wearable sensor isn’t constrained to 64 Hz or integer submultiples, for instance.
There is, also, a tendency in the medical instrumentation field for practitioners to get “used to” the idiosyncracies (i.e. sampling rate, internal signal processing artifacts) of existing equipment, and any subsequent proposed replacement needs to duplicate those idiosyncracies – because the clinical assessment is not “does it match reality”, but “does it match what we’re used to seeing, for this set of signs and patient state”. A nice example is body temperature measurement – The standard of comparison is oral or rectal temperature taken with a thermometer probe, with all their artifacts and peculiarities. If you measured true body core temperature, that may not be as clinically useful, especially at first. The doc wants to know what the oral temp is, because that’s what they’re used to seeing.
I worked at a pulse ox company. The answer is 75 Hz because then you have notches at 50 and 60 Hz, allowing you to partially cancel the flicker of lighting grids around the world.
Cool! Sort of a naïve question here. If you sample at 75 Hz, don’t 50 and 60 Hz get aliased. Are the notches hardware or software filters?
If you wanted to eliminate a given frequency, sampling at that frequency ensures you’re hitting the same point of the wave (e.g. the peak) every sample. Of course this will drift slightly over time, but mains should be pretty close to the specified frequency. So it’s not really software or hardware – it’s just math. Of course if you’re trying to eliminate two different frequencies that are not a multiple of each other, you could sample at some multiple of their period. For 50 and 60 Hz, you might sample at say 10 Hz. But as the article above describes, that’s too slow to catch interesting features of the waveform. So you end up sampling at a slightly less optimal multiple of the subharmonics and averaging.
I am researching in the field of photoplethysmography, the optical measurement principal that is utilized in wearable heart rate monitors. There has actually been an earlier study (*not* my paper) about the required sampling rate to reliably derive the heart rate variability (HRV). You can find it here:
Choi et al., 2017: “Photoplethysmography sampling frequency: pilot assessment of how low can we go to analyze pulse rate variability with reliability?” – DOI: https://doi.org/10.1088/1361-6579/aa5efa
The study concludes that 25 Hz are the required minimum sampling rate to derive the HRV measures.
If you “simply” want to extract the heart rate, so to detect the heartbeats’ average rate, even 10 Hz turned out to be sufficient: https://doi.org/10.1145/3266157.3266209 (my publication)
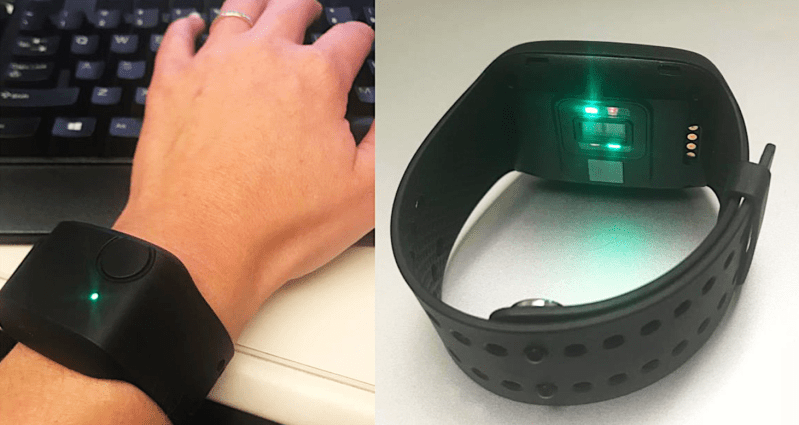
I did not read the entire paper by Bent et al. yet, just read diagonal quickly, but there are two aspects which make me a bit skeptical. Firstly, the utilized Empatica E4 device is already preprocessing and filtering the actual raw measurement signal internally, so the authors cannot really make any statement about the required sampling rate for approaches using real raw signals. Secondly, the Empatica E4 only allows to sample at 64 Hz, so there is no way to test for higher sampling rates and whether they result in a higher accuracy. Actually, they conclude that the range “21 Hz – 64 Hz” is the most suitable “, depending on the metric”. They decimated the sampling rate by factor 1 to 10, so the steps between the tested rates are quite coarse.
If you want to get an idea of the sampling strategies applied by commercial devices, I suggest you the following article (my article):
“Unity in Diversity: Sampling Strategies in Wearable Photoplethysmography” (2019): https://doi.org/10.1109/MPRV.2019.2926613
i am working on HRV detection from wrist devices and i want to know how can I can get data from HR sensors Please anyone can help me