ayan-sensor2notion-dashboard+raspberryPi

Know Which Way The Wind Blows, Whether Weather Boosts Your Mood

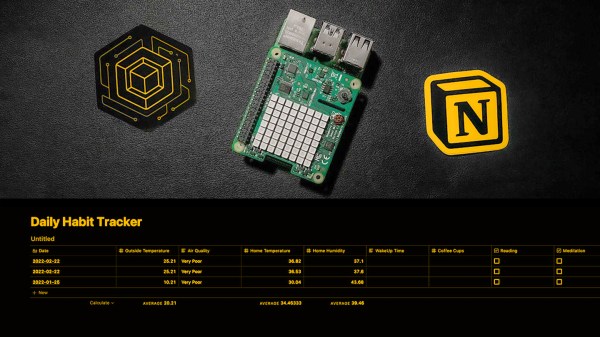
As a quantified-self experiment, [Ayan] has tracked several daily habits and moods for a couple of years and discovered some insights. Too much coffee is followed by anxiety while listening to music leads to feelings of motivation and happiness. There was a strong correlation in the data, but [Ayan] wondered if external factors like the weather and air quality also played a role.

To find out, [Ayan] extended the custom dashboard built in Notion.so with weather data and some local sensors. Working at Balena.io (yes, the makers of the ubiquitous Raspberry Pi SD card flashing tool, Etcher), [Ayan] turned to balenaCloud to translate the data from (you guessed it) a Raspberry Pi into the dashboard via Notion’s API beta. We think Notion holds a lot of promise for all sorts of web-based dashboards as a research notebook and organizational tool. Who knows where the API will lead any interested readers?

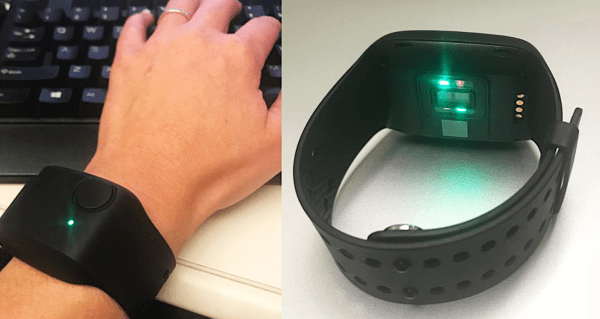
Check out the full tutorial where [Ayan] walks you through the hardware used and each step to connect the APIs that bring it all together. [Ayan] plans to add a coffee-maker integration to automate that data entry and would welcome help getting a manual trigger set up for the data integrations.

E4 Empatica device for measuring location, temperature, skin conductance, sleep, etc. on arm

Choosing The Optimal Sampling Rate For Your DIY Heart Rate Monitor

With wearables still trying to solidify themselves in the consumer health space, there are a number of factors to consider to improve the reliability of such devices in monitoring biometrics. One of the most critical such parameters is the sampling rate. By careful selection of this figure, developers can minimize errors in the measurement, preserve power, and reduce costs spent on data storage. For this reason, [Brinnae Bent] and [Dr. Jessilyn Dunn] wanted to determine the optimal sampling rate for wrist-worn optical heart rate monitors. We’ve shared their earlier paper on analyzing the accuracy of consumer health devices, so they’ve done a lot of work in this space.

The results of their paper probably don’t surprise anyone. The lower the sampling rate, the lower the accuracy of the measurement, and the higher the sampling rate the more accurate the measurement when compared to the gold standard electrocardiogram. They also found that metrics such as root mean square of successive differences (RMSSD), used for calculating heart rate variability, requires sampling rates greater than 64 Hz, the nominal sampling rate of the wearable they were investigating and of other similar devices. That might suggest why your wearable is a bit iffy when monitoring your sleeping habits. They even released the source code for their heart rate variability analysis, so there’s a nice afternoon read if you were looking for one.

What really stood out to us about their work is how they thoroughly backed up their claims with data. Something crowdfunding campaigns could really learn from.