I’ll confess. Although printf-style debugging has a bad rep, I find myself turning to it on occasion. Sure, printf is expensive and brings in a lot of code, but if you have the space and time to use it while debugging you can always remove it before you are finished. However, what if you don’t have an output device or you are using it for something else? If you are using most modern ARM chips, you have another option — a dedicated output channel that is used for several things, including debugging output. I decided I wanted to try that on the Blackpill running mbed, and found out it isn’t as easy as you might think. But it is possible, and when you are done reading, you’ll be able to do it, too.
I’m writing this using the STM32-specific ST-LINK hardware. If you use other JTAG devices like the BlackMagic probe, you probably already have this set up for you.
What You Get
I’ll start backward with the end result, then talk about the software, so you’ll be good and motivated by the time you get to the hardware requirements. Spoiler alert: your existing hardware might need a quick hack to make it work, although you can buy something off the shelf if you prefer.
Here is a very simple test program:
SWO_Channel debugport;  // requires #include "SWO.h"
int main()
  {
  unsigned count=0;
  debugport.printf("\r\nHello World from SWO\r\n");
  debugport.printf("CPU SystemCoreClock is %d Hz\r\n", SystemCoreClock);

  while (1)
    {
    led = !led; // flip LED if output is true
    ThisThread::sleep_for(rate); // sleepy time
    if (count % 10) debugport.putc('*'); else debugport.printf("%d\r\n",count);
    count++;
    }
}
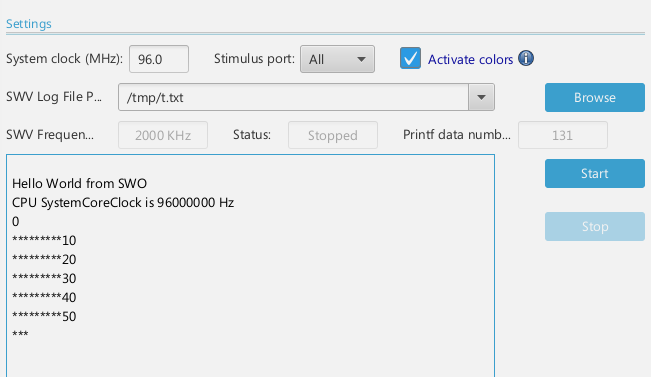
Nothing hard to imagine here. You can use putc or printf to write to the debugging output. As you can see in the figure, you get a nice window that shows all the output. There are actually 32 channels of output, but channel 0 is reserved for the debugging output. In this case, I picked All because its the only thing coming out of the device, anyway.
What You Need
First, you need a compatible ARM chip. Not all ARM chips support ITM — the Integrated Trace Macrocell — but that’s what you need. There will be one pin on the device marked SWO (and probably other things, too). Since I’m using the Blackpill with an STM32F411CE, we know it should work and the output pin will be PB3.
You also need an ST-Link dongle that has an SWO pin. Unfortunately, the cheap ones that look like a USB memory device you typically get don’t have the SWO pin. You can, however, easily hack them. The “full” ST-Link V2 has the pin brought out, but is usually a lot more expensive. However, if you shop the usual Chinese shops, you can usually find one for a reasonable price. I paid less than $10.
Of course, you also need some sort of tool to read the output. A normal terminal won’t do it, but ST’s STM32CubeProgrammer can easily read the data. There are, of course, other options, too. Many IDEs and debuggers can read SWO output. There are also some open source tools, but the Ubuntu packages are too old and the release packages didn’t work. Building it from scratch did work, though.
Software Setup
Since I’m using Mbed, the first thing I did was go looking for a library. I wasn’t disappointed. The library is a thin wrapper around the ITM functions in CMSIS, so if you aren’t using Mbed, just have a look at those functions and you’ll be able to figure it out. If you prefer STM32Duino, check this out for something similar.
Once I added it to the project, I had to fix one small thing. It probably didn’t matter, but there is an instance where an array is allocated for a file name and then deleted improperly. Note the delete in the code below:
bool SWO_Channel::claim (FILE *stream) {
  if ( FileBase::getName() == NULL) {
  error("claim requires a name to be given in the instantiator of the SWO instance!\r\n");
  }

//Add '/' before name:
  char *path = new char[strlen(FileBase::getName()) + 2];
  sprintf(path, "/%s", FileBase::getName());

  if (freopen(path, "w", stream) == NULL) {
// Failed, should not happen
  return false;
}

  delete [] path;   //  fixed

//No buffering
  setvbuf(stream, NULL, _IONBF, 32);
  return true;
}
Once that’s done, you are good to go. You just need some hardware.
Hardware Setup
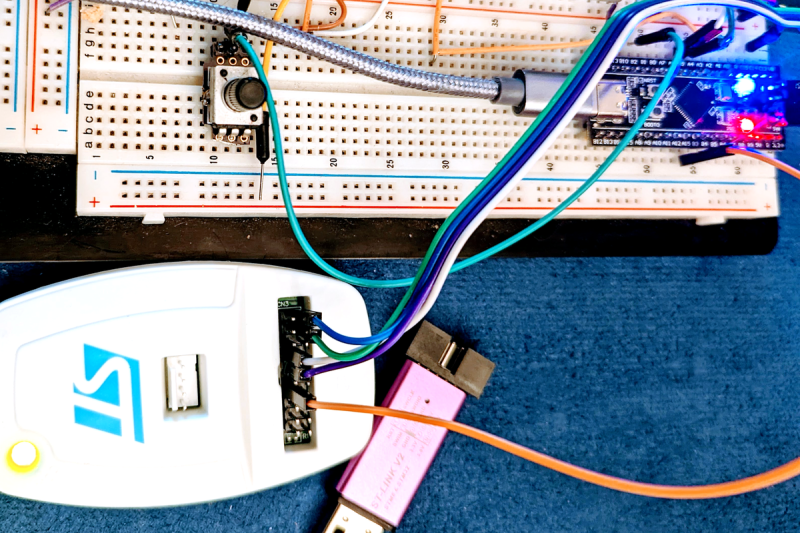
If you have the “normal” ST dongle like the white one in the picture below, the setup is just the normal setup. Connect power, ground, and the two debugging pins to the back connector of the Blackpill and then run a wire from SWO to the B4 pin on the device.
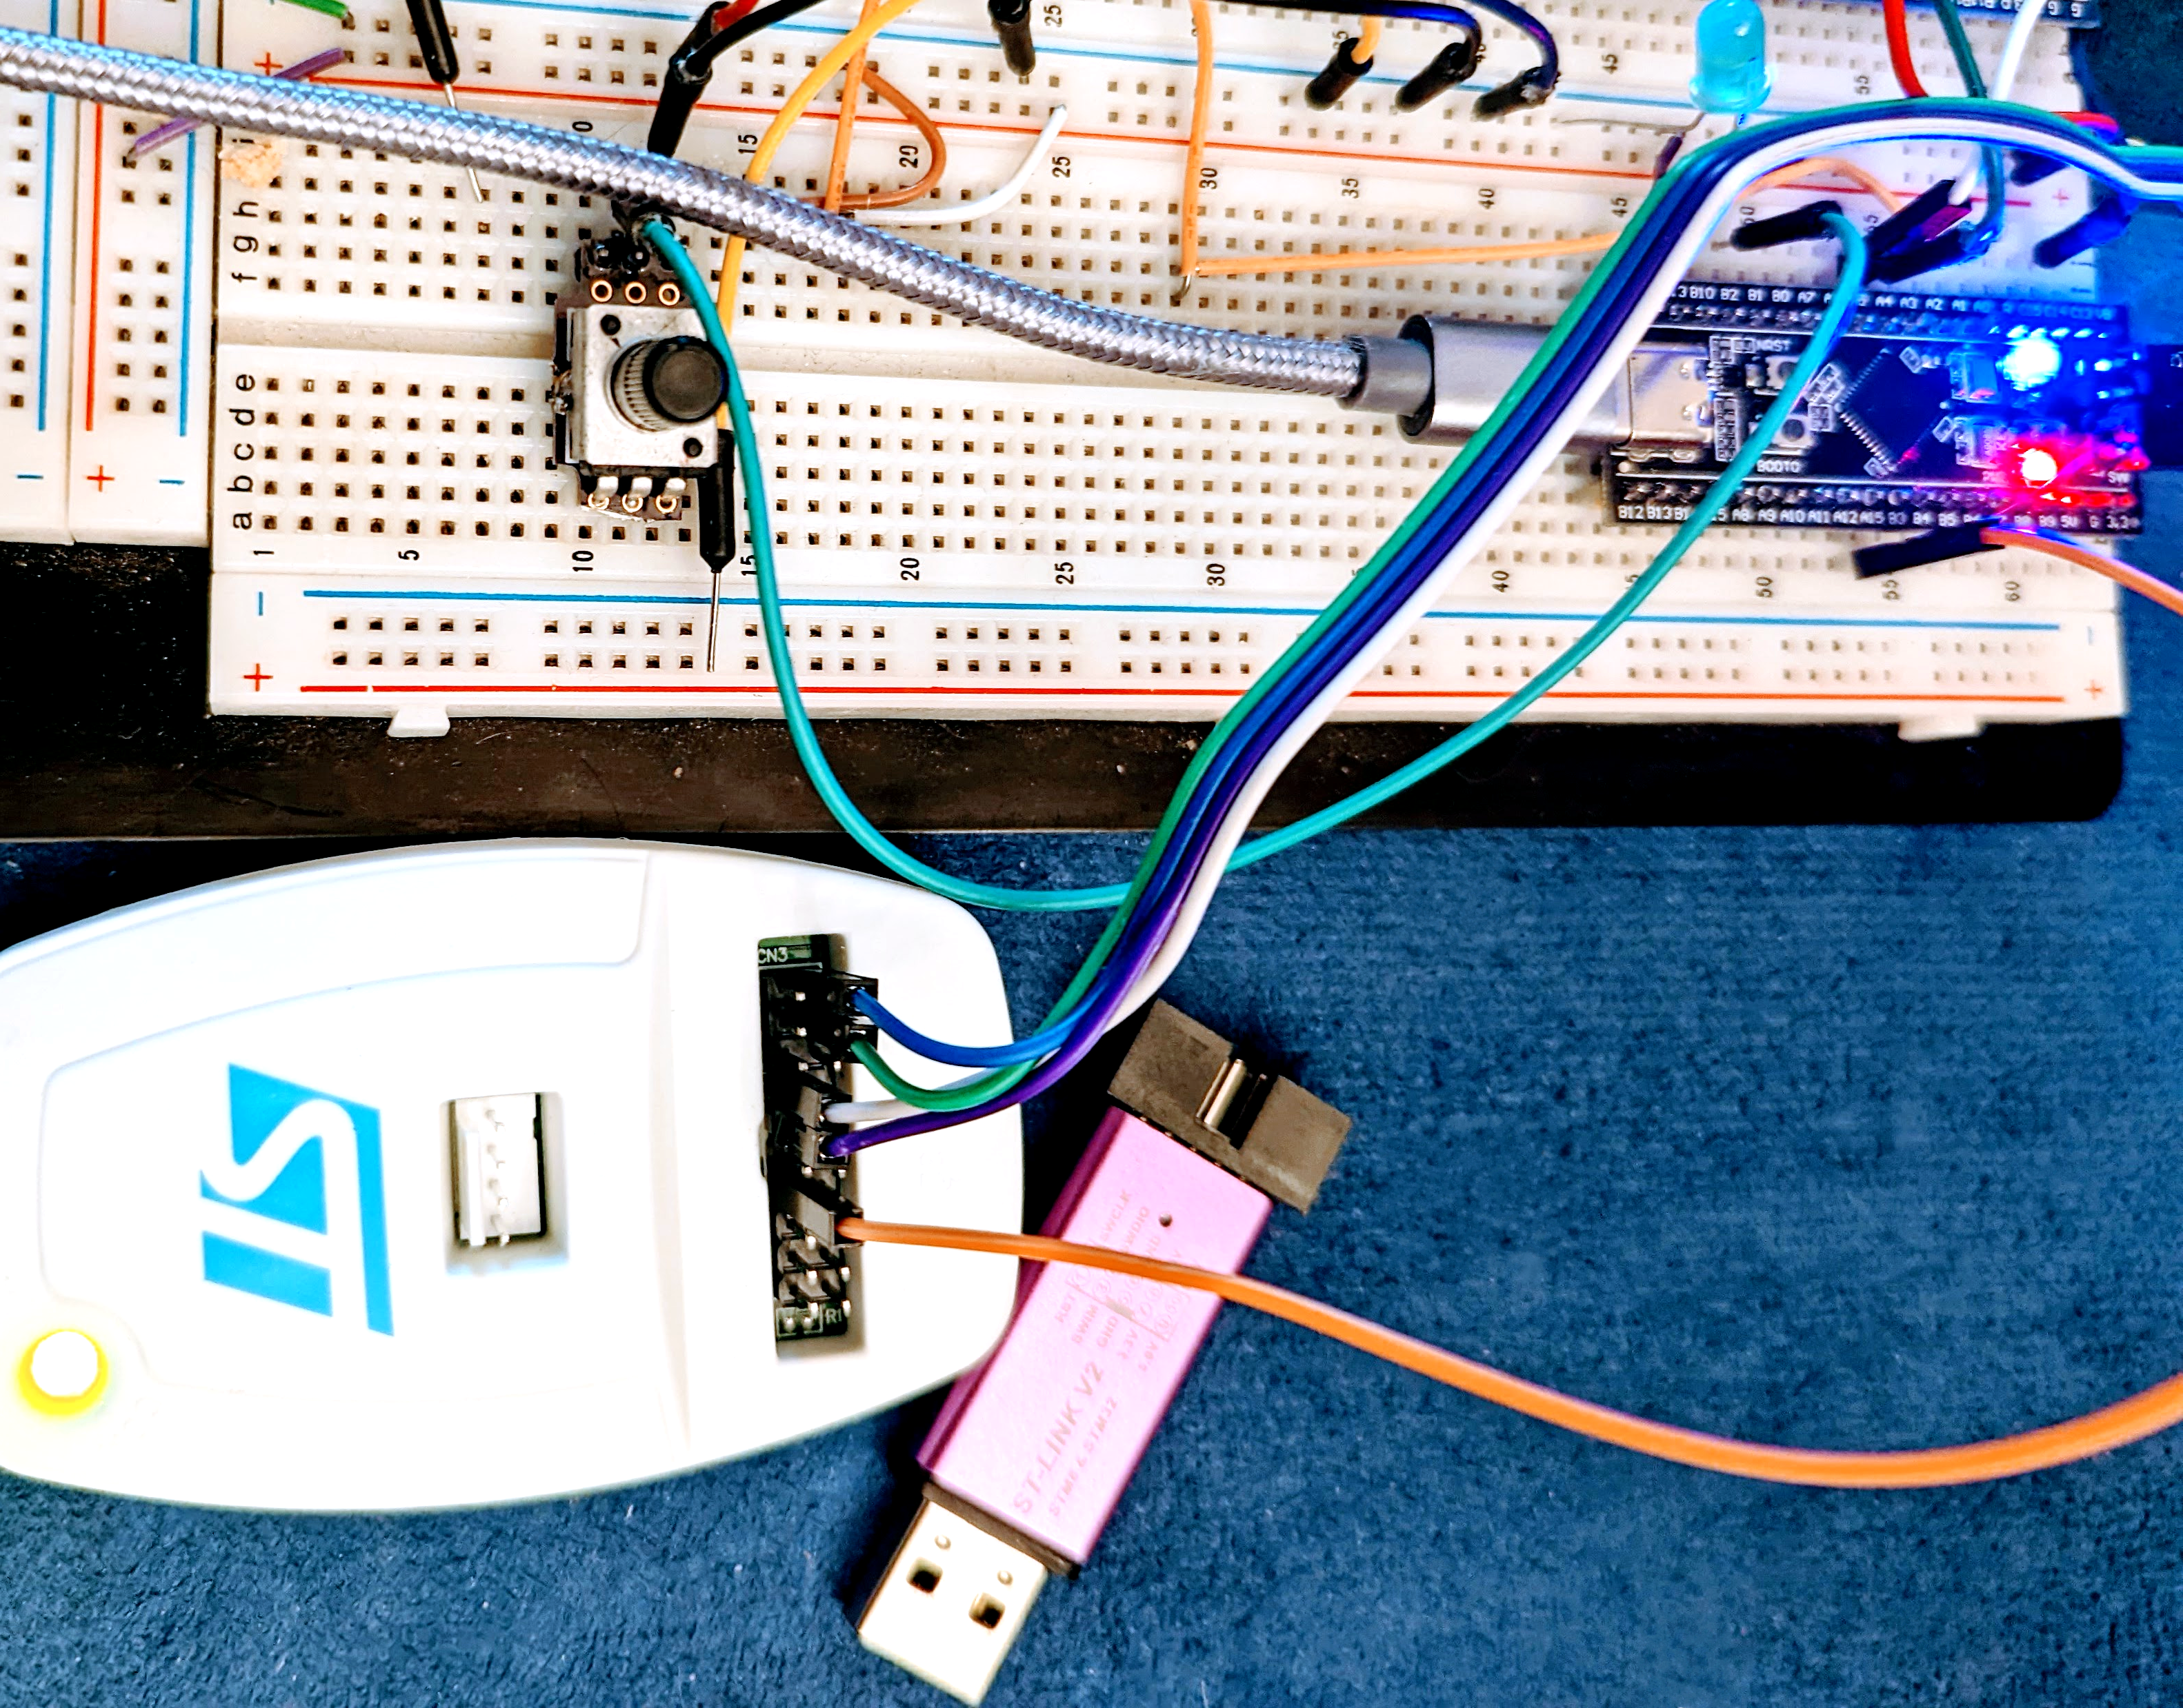
If you have one of the cheap clones like the purple one sitting next to the white device, you’ll need to do some surgery to bring out an extra pin.
Load a program that does some simple SWO output and then fire everything up. You may need to upgrade the ST-Link’s firmware — the STM32CubeProgrammer software can do that, too.
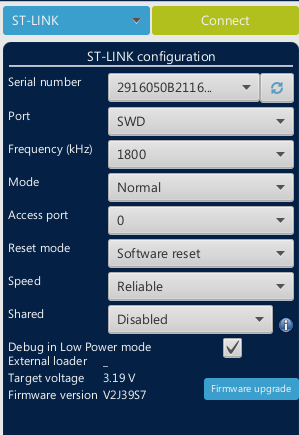
When connecting to the hardware with the programmer, I found that the white dongle didn’t reliably connect at 4000 kHz, so I had to select 1800 kHz. That may just be that device or my haphazard wiring. You can see the connection info I’m using in the adjacent screenshot. Press Connect to get started.
 When you select the SWV item, you’ll need to set a clock of 96 MHz for this setup. Presumably, if you are running at a different frequency, you’d know the right value for your setup. When you press Start, you should see output from the program.
The only thing to remember is that your software will fight over the dongle unless it has been made to work in the “shared” mode. In my case, Mbed Studio didn’t seem to care about that setting so you have to disconnect if you want it to reprogram the chip. Of course, you could use the programmer to do everything. It will all depend on your tools and setup.
Of course, once you have it going once, it is pretty easy to replicate for future projects. You only have one extra wire and two extra files in your program.
Going Further
You can go further, though. First, there’s colorful output. If your debug string contains #RED#, #GRN#, or #ORG# the remaining characters will be in that color (red, green, or orange) for the rest of the line. Assuming, of course, the viewer understands that and you have it turned on. It is handy to be able to show important messages in red, for example.
However, it is a waste that there are so many extra channels we aren’t using. For example, why not have progress messages on channel 0 and detailed debugging info on channel 1? You could have a dump of what’s coming in from an external device on channel 5. Sure, you could write a prefix on the line and pull the data out that way, but this is more fun.
I rewrote a very small bit of the existing SWO class and, thanks to optional arguments, it still works the same. The only difference is you can add a channel number to the constructor so it is possible to create more than one debug stream:
SWO_Channel debugport;
SWO_Channel dbg2("second",1);
There are very few changes to the code, but I’ll leave the whole project up on GitHub.
If you can’t tell, I enjoy working with the STM32 and Mbed. Sure, you can get better performance by sidestepping Mbed, but the good thing is that you can. Oddly enough, pushing data over one port into several channels is something I’ve done before in a completely different way.


Other alternatives that work using the debug port and thus do not require other resources such as GPIO pins or UART devices are GDB semihosting and RTT. The later is the one I would recommend because although semihosting is usually easier to setup, it is VERY SLOW. I talk a bit about these techniques, although mainly with a Rust perspective: https://kernelhacks.blogspot.com/2021/08/evaluating-rust-for-embedded-firmware.html
Yeah semihosting is clever but very slow. I think RTT only works on Segger no?
It was initially developed by Segger, but I think they released the protocol and it does not need a Segger anymore. I have used it without a problem with a chinese ST-Link2 clone.
No, RTT is just a C code that you embbed in your code, and this code has no limitations
OpenOCD already supports it using any of the supported hardware adaptors
I also wrote about it:
https://laureano.cc/2021/05/17/using-openocd-rpi-pico-rtt-with-a-stm32/
Nice post! I’ll have to try this.
Technically you can use the SWD pins as GPIO. I sometimes use them when i run out of IO for low priority tasks that can be disabled when i need to debug.
For decoding SWO data, orbuculum is great: https://github.com/orbcode/orbuculum
And there is much more to SWO than just printf(). You can have it report program counter value every 2^N instructions, to have realtime display of what the CPU is up to. And for higher-speed debug output, you don’t need to convert them to text – SWO can transmit up to 32-bit binary values.
For debug output segger rtt is IMO easier and quite elegant solution, no hardware except swd is needed. The code is open source and openocd supports it too. It works via circular ram buffer which is watched via swd.
I once wrote a very small but quite handy debug library.
It was able to turn itself on and off.
It could bit bang a single character to an I/O port.
For each insertion of the macro, it added 8 instructions into the code. start bit, some data bits, stop bit.
I used this to catch debug info with Sigrok / Pulseview, and this worked wonderfully well.
I has a rather complicated ISR function, which was about 50 lines of code, and it does a bunch of things. It counts incoming bytes, on the 6th byte it reads the length of a message, it resets and re-initialises itself on an error, and when a packet is complete it sets a flag and disables itself until the packet is handled by the main routine.
By inserting the debug instructions I was easily able to follow the route for each incoming byte, including ISR latency and other timing related info, because Pulseview had a trace for all of RxD, TxD, RS485 enable and debug.
Impact of timing in the ISR was minimal. I did this on an AVR and it pumped out the debug info at a few MegaBaud. Each debug character was shorter then a single bit on the 115k2baud line.
And if you have a spare UAR or SPI, you can also use that, and the debug may be only two instruction to read a constant and put in the UDR or equivalent register.
I was very pleased with this.
Always good to have another tool in the toolbox, but modern ARM MCUs almost always have more than enough UARTs, and I’d always rather implement that than something ARM-subset-specific. If you’re already doing SWD, though, it might be worth it.
“The “full” ST-Link V2 has the pin brought out, but is usually a lot more expensive. However, if you shop the usual Chinese shops, you can usually find one for a reasonable price. I paid less than $10.”
There is no need to buy a ST-Link from Chinese shops (at least in normal times). The ST-Link V3 Mini is usually available for a completely reasonable 10€/$10 and you know you will get a working device with vendor support.
Of course they are all sold-out nowadays, but the same is true for almost any STM32 so it doesn’t matter.
Is buying a Nucleo board and snapping off the programmer/header part still a viable option? Requires a tiny bit of soldering and/or building connectors by hand, but you get a dev board “for free” along with the programmer.
Yes, that’s my default approach!
I use a different method. The printf() function just writes the data in a circular buffer, and I use the SWD interface to read it out directly from memory.
which is exactly how Segger RTT works, see
https://github.com/adfernandes/segger-rtt
Except that my code is 53 lines instead of 2000.
Big vote here for Black Magic Probe, you can flash it to a bluepill board or the cheap USB-Stick ST-Link clones but Black Magic deserve your pennies for their efforts.
It works lovely with ‘GDB -tui’ on the command line and I’ve found it’s a faster and more intuitive setup than the built-in IDE stuff.
ITM is of course Instrumentation Trace Macrocell. One caveat is that ITM is not designed for streaming data and will mark an overflow in the trace rather than generating back pressure. The reason for this approach is to reduce the impact of adding instrumentation to the real-time behaviour. As noted, there are other instrumentation trace (and watchpoint) features which also help with real-time debug, not even needing any software overhead. Some tools can post-process the received data and expand symbols and channels into messages at the debugger side.
What I’ve always wondered is if you can use SWO while debugging? I asked an intern to look into it once and he concluded “no”, but I’m still not sure. If you can’t it makes SWO almost useless to me as a non-debug build (aka production) should never have any access to internals.
I was hoping to see that information in this article.
It uses it’s own SWO pin whereas SWD uses the SWD (amongst other) pins. Ergo, no issue.
The way I generally do it with STM32 is just to use the STM32CubeIDE and use the debug feature of that, you aren’t then just relying on error messages you can actually step it through and check the value of variables, it just makes it a lot easier to debug than just a few debug messages, it also makes it easier because just using debug messages if you decide to change what variable you are printing out then you need to change the code and recompile where with the debug feature you just need to look for that variable and you get the value, it also means you don’t need to remove your debugging code to have a finished product, all you need to do is compile it for release.
Sometimes you cannot analyze or step through code because the act of doing so changes the outcome. This is usually only the case when debugging interrupts. In those scenarios printing out live data to a terminal is invaluable
Not just interrupts, but also many other real time systems. For example, a communication protocol may time out if you’re single stepping, which totally changes the behavior.
If you’re on rust then defmt over RTT is a very nice solution that saves having to transport whole strings, but rather just the variables and a string index. It all happens relatively transparently.
https://github.com/knurling-rs/defmt
I have sometimes simply made a ram buffer and dumped that via normal swd. There is a library (RTT) that will give a full console.
With a few extra options you can read the SWO output inside Mbed Studio using telnet or orbcat: https://hackaday.io/project/185698-swo-with-mbed-studio