There are some fairly powerful debugging facilities available on today’s microcontrollers — if your code crashes mysteriously, chances are, there’s a debugging interface that could let you track down the exact crash circumstances in no time. Sadly, debugging tools for these powerful interfaces tend to be prohibitively expensive and highly proprietary, thus, not friendly for hobbyists. Now, there’s a community-driven high-capability debugging platform called ORBTrace, brought to us by [mubes] and [zyp].
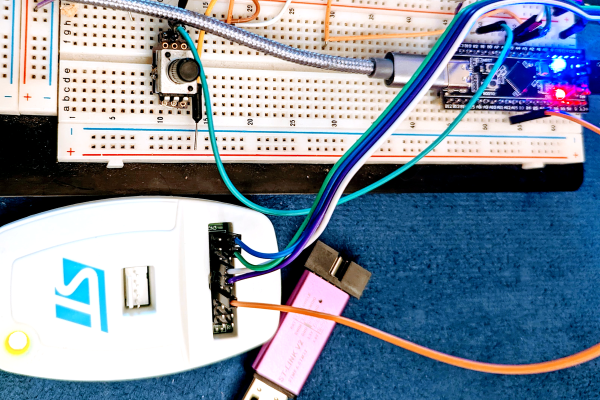
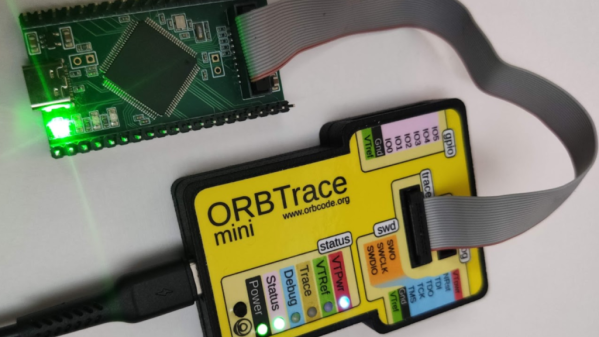
With parallel trace, you get a constant stream of consciousness, every exact instruction executed by your CPU. [mubes] and [zyp] set out to tap into the power of parallel trace debugging for Cortex-M processors. and the ORBTrace project was born. Relying on the Orbuculum project’s software capabilities, this FPGA-based debugger platform can do parallel trace and the more popular high-speed SWO trace – and way more. ORBTrace has the potential to grow into a powerful debug helper tool, with enough capabilities for anyone to benefit. And of course, it’s fully open-source.
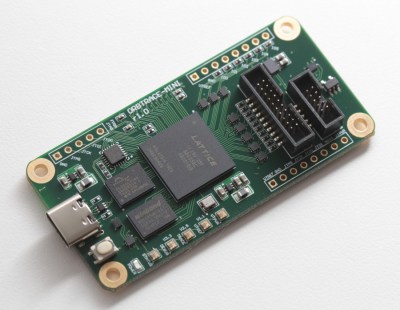 The ORBTrace platform has plenty of untapped potential. There’s the battle-tested JTAG and SWD that you can already use with all the open tools you could expect. However, there’s also plenty of available resources on the FPGA, including even a currently unutilized RISC-V softcore. If you wanted to add support for any other family of devices to this debugger, sky’s the limit! And, of course, there’s cool software to go with it – for example, orbmortem, which keeps a ring buffer of instructions in memory and shows you the last code executed before your CPU stops, or orbstat, a tool for profiling your embedded code.
If you’re looking to purchase effortless feature parity with Segger or Lauterbach devices, the ORBTrace doesn’t promise that. Instead, it’s an open debugging toolkit project, with hardware available for purchase, and software just waiting for you take control of it. This project’s community hangs out in the 1BitSquared discord’s #orbuculum channel, and gateware’s advancing at a rapid pace – welcoming you to join in on the fun.
ORBTrace is a powerful tool for when your goals become large and your problems become complex. And, being a community-driven experimental effort, we’ll undoubtedly see great things come out of it – like the Mooltipass project, originally developed by Hackaday community members, and still going strong.