
If you want to buy a car, there are plenty of choices. If you want to buy a jetliner, there are fewer choices. If you want to use the Large Hadron Collider, you have a choice of exactly one. The harder something is to create, the less likely there is to be many of them. If you are looking for a Linux debugger, there are only a few choices, but gdb is certainly the one you will find most often. There is lldb and a handful of non-open commercial offerings, but for the most part you will use gdb to debug software on Linux.
Of course, not everyone’s a fan of gdb’s text-based interface, so there’s no shortage of front ends available for it. In fact, gdb has two potentially built-in interfaces although depending on how you install gdb, you might not have both of them. Of course, if you use an IDE, it very likely is a front end for gdb among other things. But at the core is gdb and — usually — there is a window somewhere that you can stuff gdb commands into. Even emacs — which might be considered the original IDE — can run gdb and gives you a sort-of GUI experience.
No Front End Required
There was a time when Insight was popular. This wasn’t a front end to gdb. It was an actual copy of gdb with a Tk/Tcl GUI built into it. It fell out of favor, though, because of packaging issues, something my old friend Jeff Duntemann covered at length back when everyone sort of dropped it.
However, there is still a way to use gdb a little nicer without a front end. The -tui flag. This gives you not a graphical user interface, but a textual user interface like the one you can see below.
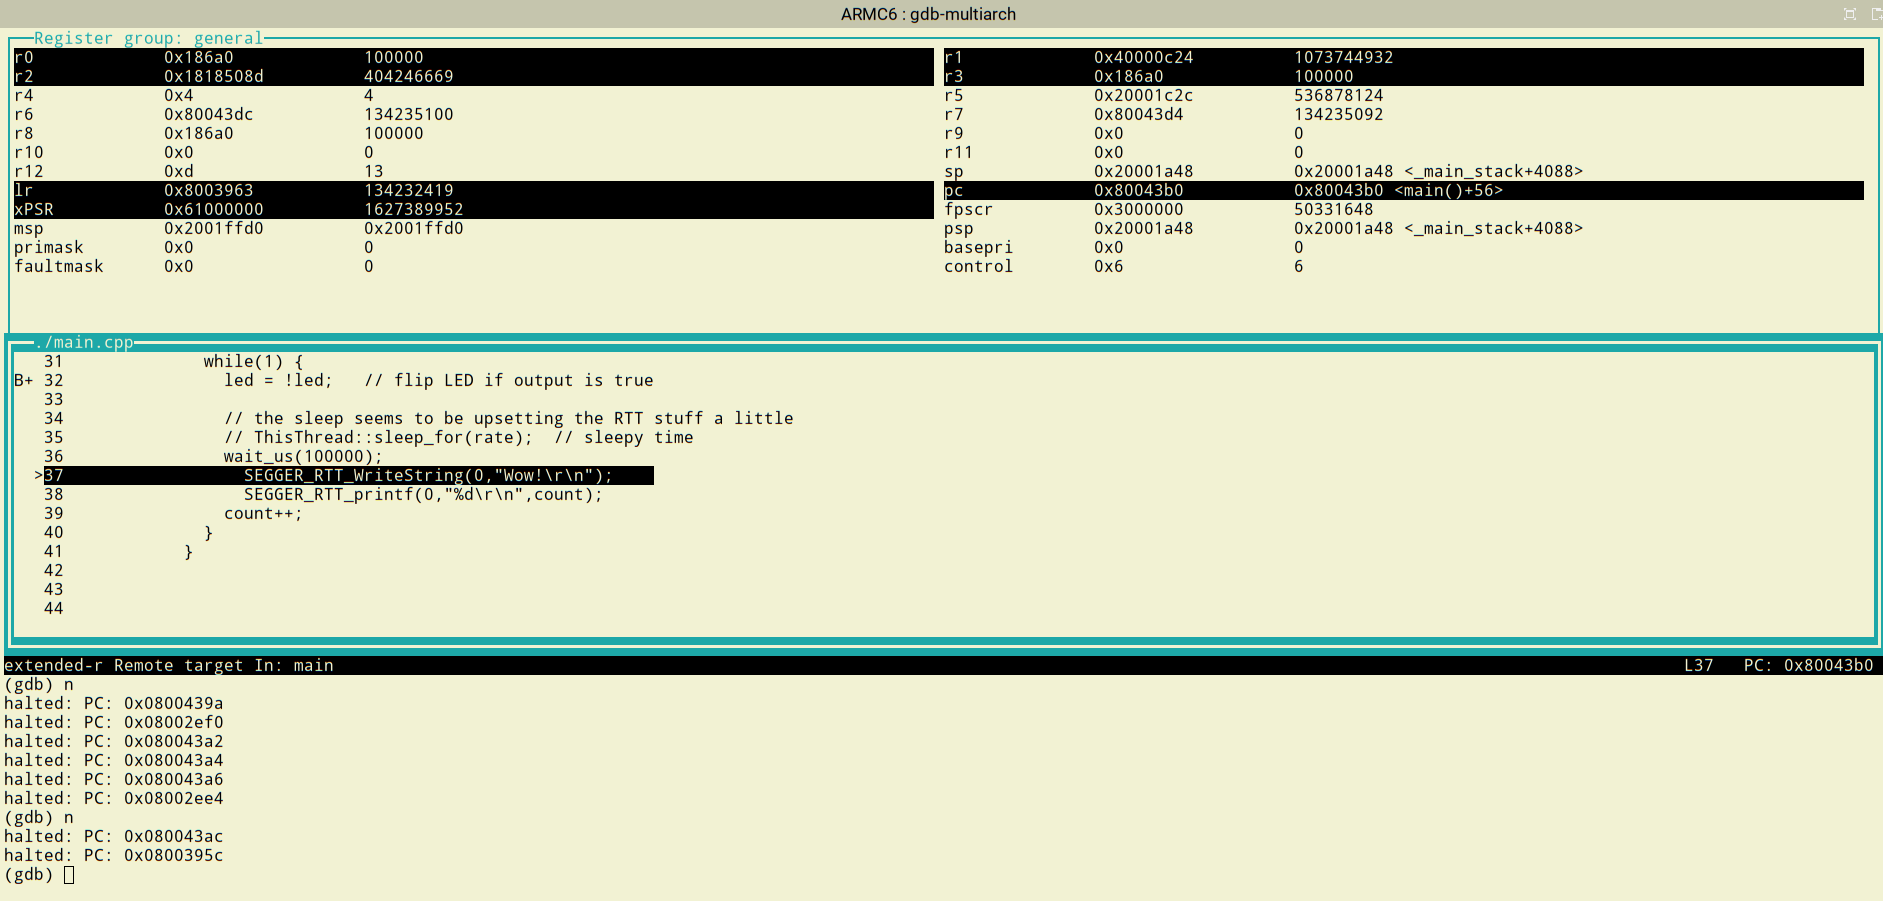
While I’m not always a fan of GUIs, debugging is one place where it makes sense to have a lot of information on the screen at once, so it is one place I will often try to use something a little nicer than a bare command line. The default view just shows your source code and the command window, but you can also turn on a register display, enable a disassembly display, and change the layout of everything. Try the command “layout split” or “layout regs” to see some different displays. The “layout src” command will put things back to how they started. If you want to get serious about using TUI mode, check out the documentation. It is worth noting that you can use “tui enable” to turn this mode on at any time and “tui disable” to turn it off and go back to plain gdb.
Why Not Web?
These days, everything runs in a web browser so why not your debugger? The gdbgui front end does just that. Of course, the debugger isn’t running in the browser, only the user interface which connects to a local server. You can see the program running against an ARM executable using gdb-multiarch in the accompanying figure.
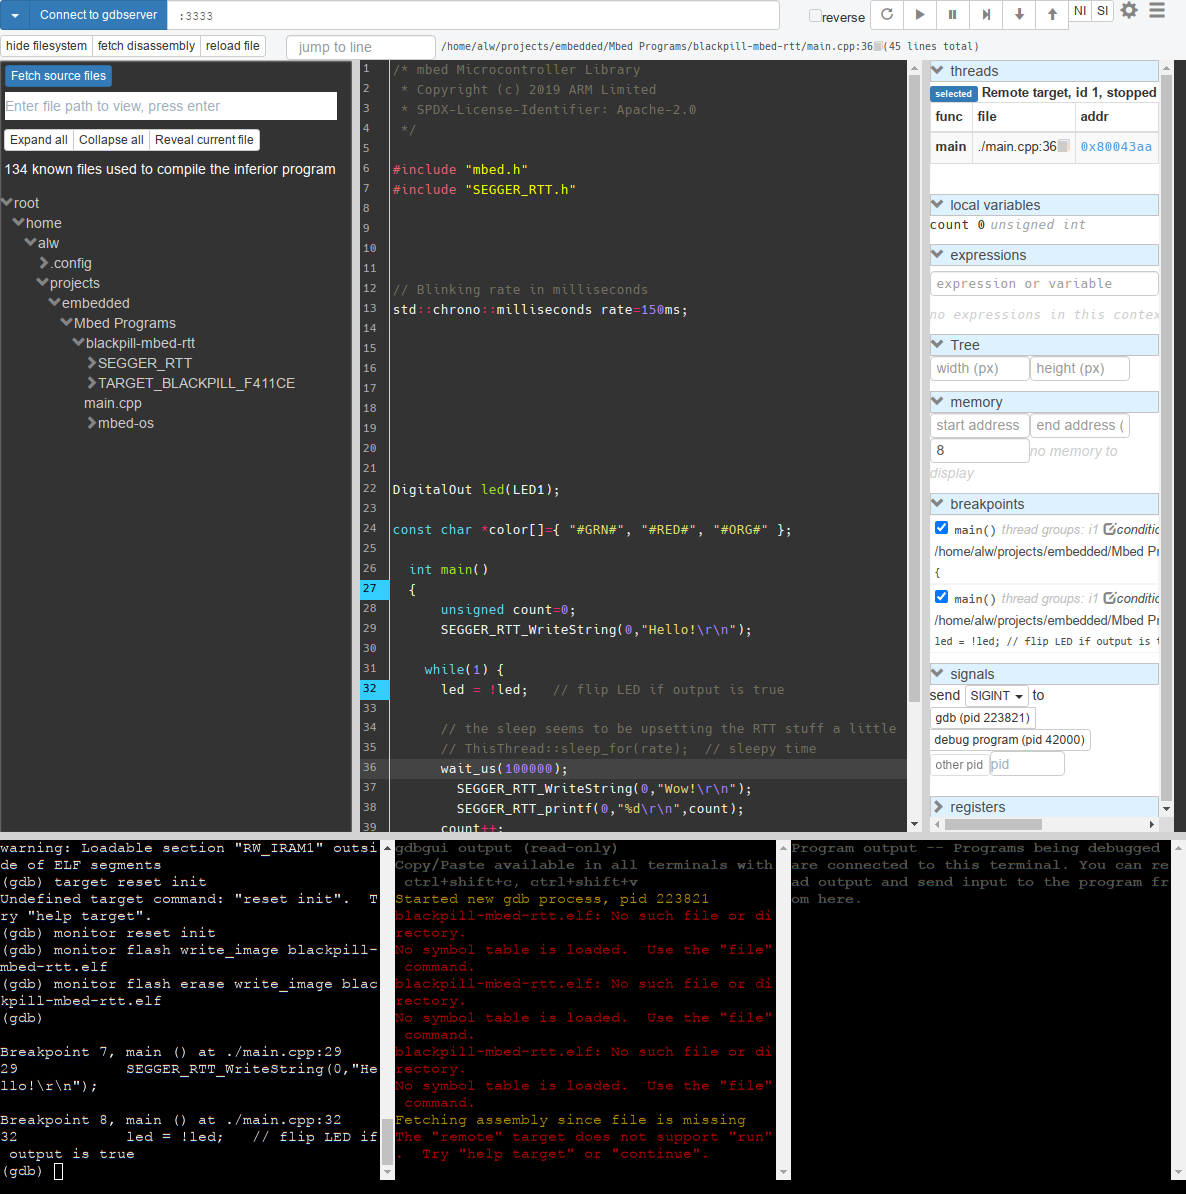
All the front ends, of course, look for the normal gdb executable. But if you are debugging something remotely like an AVR or ARM chip, you’ll need to find the way to point to the correct gdb program. For gdbgui, that’s the -g option on the command line. It wasn’t obvious if there was a way to connect to the server (OpenOCD, in this case) using the extended-remote protocol. By default, at least, it used the standard remote protocol which is less capable.
Another similar choice that runs the interface in the browser is gdbfrontend. It also takes a -g or –gdb-executable option to set a different choice of underlying gdb program. You can see how it looks below.
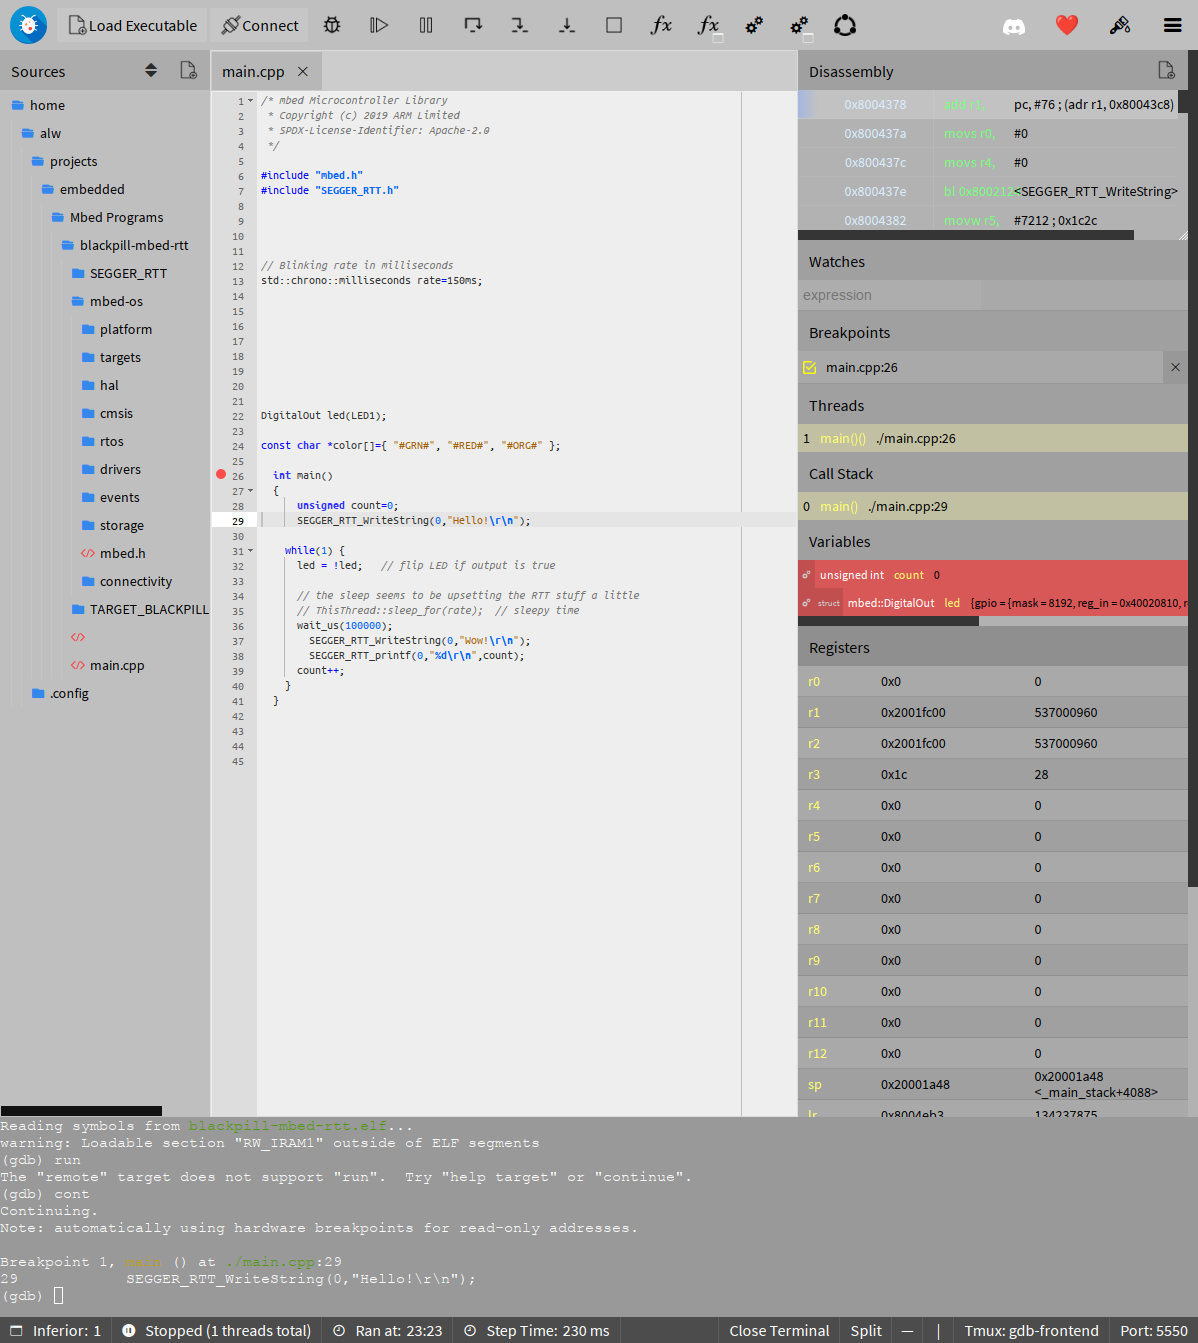
Like gdbgui, there doesn’t seem to be a way to configure the front end to use the extended remote protocol, which causes some limitations when debugging with OpenOCD. One interesting feature is the collaboration button which lets you draw on the screen, presumably while screen sharing with someone or projecting your screen for a classroom.
Other Choices
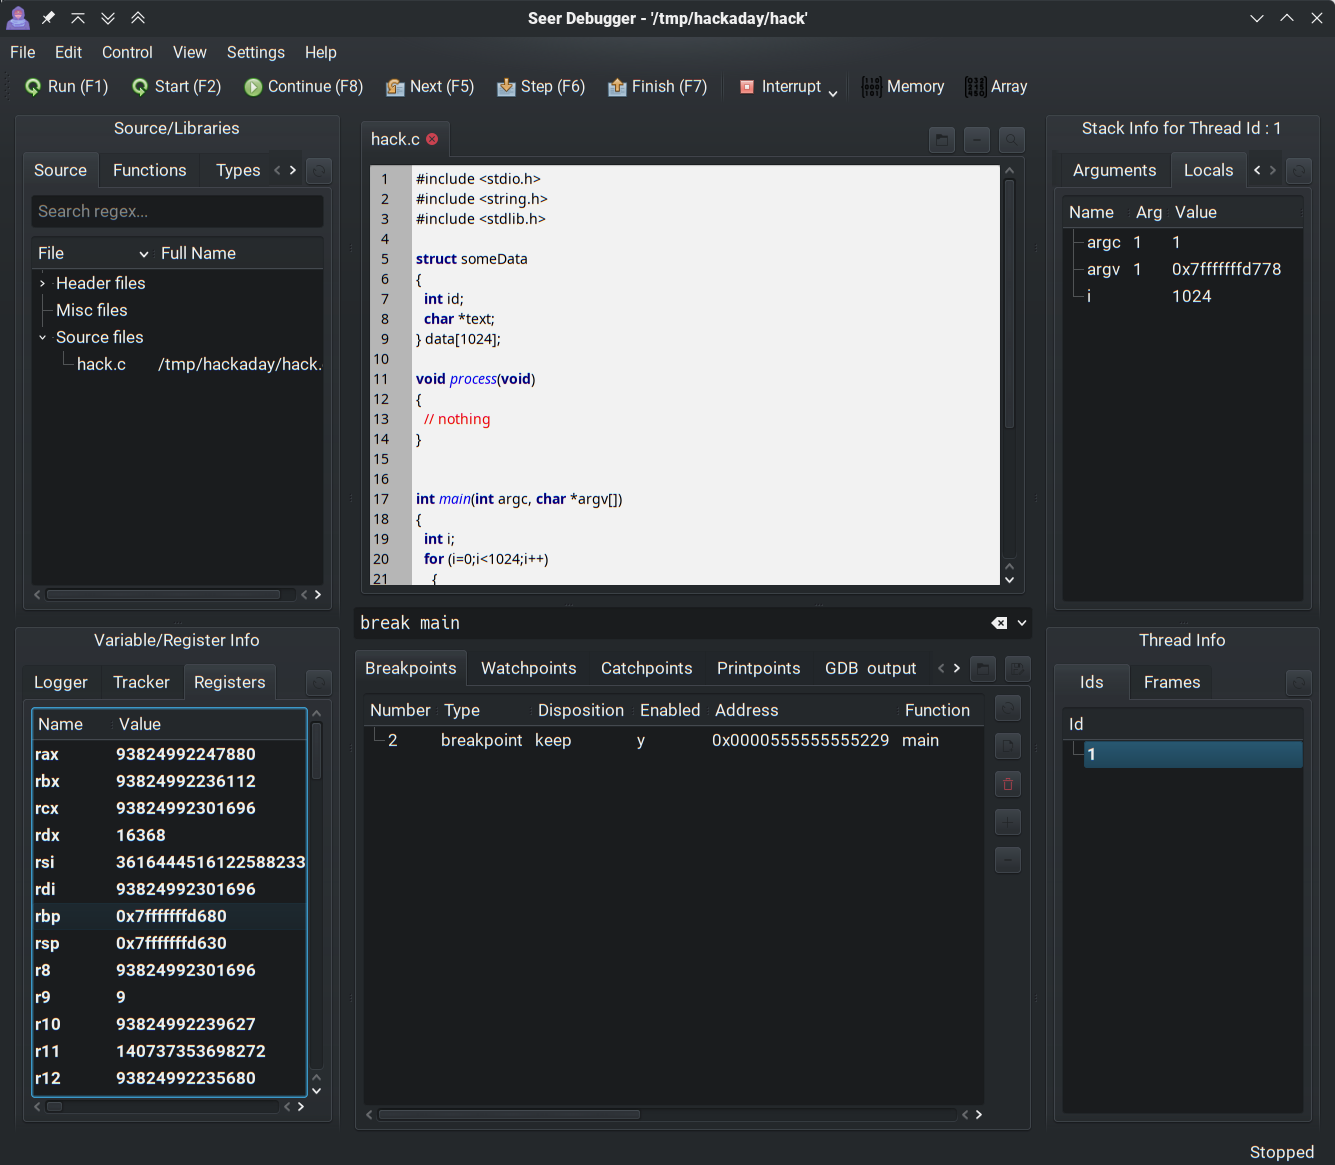
Another good-looking option is Seer which does not run in a browser. Note that this is not the same as the seer package in Ubuntu, unfortunately. For seer, you’ll have to exit the first dialog to pop up and head over to Settings to change the gdb executable. However, I had problems setting breakpoints in the GUI. It did seem like breakpoints would work if you used the gdb terminal, but that sort of defeats the purpose. It does look like it has an interesting “array visualizer” if you can get it to work. I settled for a shot of seer debugging a really simple Linux program and it did fine at that.
I suspect that all of these programs work just fine using normal gdb on a regular Linux ELF file. All of the problems were doubtless because I was using OpenOCD as a gdbserver and talking to a remote ARM chip which is probably not something the developers test very often. Even so, the two browser-based tools were able to get the job done, even though they ignored the extended protocol’s features.
Do you care? If you use an IDE that integrates gdb, maybe not. Or maybe you are too tough to use a debugger at all. That’s fine. But for the times you need gdb, these frontends can make you more productive and give you more attention to focus on what really matters: finding the bug.
Honestly, if you are thinking of using the TUI interface, check out the dashboard we talked about earlier this year. If you haven’t gotten your feet wet with gdb remote debugging, Maya Posch has got your back.


There’s also emacs and VS Code, both have nice debugger integration, both are cross platform and both are free to use. emacs runs in a text window if you like that sort of thing. VS Code has a nice uniform interface for debugging in many languages including python and JavaScript.
Yah I mentioned emacs I think (I use it a lot). But I was trying to avoid IDEs most of which have good gdb integration now. VSCode, Eclipse, etc. etc. etc.
Eclipse is not a good tool. It is not well maintained and it uses too many resources. VS code is the opposite, lean and mean and it gets lots of developer love. Smearing eclipse and VS code with the same brush is misleading. All IDEs are not the same, gdb integration is complex and different ones do it differently. What are those other etcs?
I personally dislike Eclipse, but I know people who swear by it. The etc is just about every IDE I’ve ever seen in the last decade. BVRDE, CLion, KDevelop, NetBeans, CodeLite, QtCreator, SlickEdit, Code::Blocks. I have used at least 4 of those as well as emacs (all the time), Eclipse, and VS Code.
Whatever you do NEVER stare at Eclipse, you will go blind!
One trick with emacs is that you can do a simple remote debug session (if gdb is on a remote machine) by launching gdb through ssh. This is really useful for apps on top of “embedded” linux where its a pretty robust machine — you just dont have the source code and your dev env on the target.
Also consider using gef. https://gef.readthedocs.io/en/master/
Thanks for the article. Personally I’ve never used a gdb front end in Linux or even Windows where I used/use mingw and mingw64 for projects over the years. Always just used straight gdb from command line. I have used the ide debugger that came with Borland Turbo Pascal/Delphi/c++ to step through applications though. Anyway, might have to look into a non-web one, just for fun as I can see the usefulness of all the information automatically being present without keying in a command.
One neat trick with GDB is using the GDB/MI to write assembly/machine level tests. I’ve used https://github.com/mcarpenter/rubug in the past to accomplish this. Some people cringe at this being a ruby library, so alternatives are welcome.
Why cringe at Ruby, a language
Why cringe at Ruby, a language expressly designed to bring the programmer joy?
I used to use ddd, and found it to be a pretty nice front-end to gdb:
https://www.gnu.org/software/ddd/
just tried my avr-gdb (from microchip prepackeged) and arm-none-eabi-gdb (from arm) and both have it… Will give it a try…
Wonder if TI arm and MSP430 prepacked tools have it?
One might be interested into GDB terminal-based interfaces: GDB-Dashboard [1], GEF [2], and PEDA [3].
The first one being general, and the last ones being reverse engineering oriented.
[1] https://github.com/cyrus-and/gdb-dashboard
[2] https://github.com/hugsy/gef
[3] https://github.com/longld/peda
The most powerful feature of GDB is its built-in Python scripting. And no UI support it. So I’ll stick with the command line GDB for a while.
Well just about every one of the GUIs still has a prompt where you can do everything you always do.
Is there something that you can do with your pure command-line GDB that you could not do with a TUI/GUI having a prompt to type GDB commands? I’m curious.
Hi Al,
A very interesting article. Also, thanks for mentioning my Seer project.
As the author of Seer, I’m looking for ways to improve it. Debugging emedded apps is on my radar. However, I must admit, I don’t know much about it (although I have my suspicions that are probably wrong :^).
I’ve created a discussion topic for embedded debugging with gdb.
https://github.com/epasveer/seer/discussions/67
If you, or any of your readers, can post comments, suggestions, experiences, it would be greatly appreciated. Give Seer a try and let me know of its deficiencies and possible improvements.
(PS. Al, can you let me know of the details of ‘set breakpoint’ problem you encountered? Screenshots, error messages, etc.)
Thanks again!
When you only have terminal access to eg a Linux system (like a RPi), I think cgdb is a good option. It is quite vi:ish and easy to use in my opinion. It provides a source view and a cli in parallell.