While high-fidelity audio has come a long way in the past several decades, a lot of modern stereo equipment is still missing out on some of the old analog meters that were common on amplifiers and receivers of the 60s through the 80s. Things like VU meters don’t tend to be common anymore, but it is possible to build them back in to your sound system with the help of some microcontrollers. [Mark] shows us exactly how to reclaim some of the old-school functionality with this twin audio visualizer display.
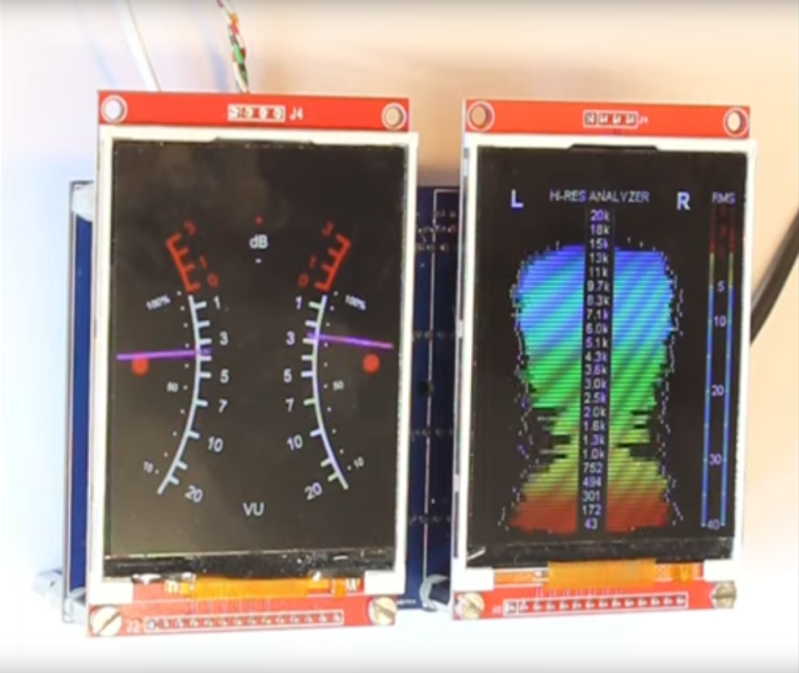
Not only does this build include two displays, but the microcontroller is keeping up with 170 channels in real-time in order to drive the display. What’s more impressive is that it’s being done all on a Teensy 4.1. To help manage all of the data and keep the speed as fast as possible it uses external RAM soldered to the board, and a second Teensy audio board is used to do the real time FFT analysis. Most of the channels are sent to the display hosting the spectrum analyzer but two are reserved for left and right stereo VU meters on the second display.
The project from [Mark] is originally based on this software from [DIYLAB] so everything is open-source. While it was originally built for a specific piece of hardware, [Mark] has it set up with a line in and line out plus a microphone input so it can be used for virtually any audio hardware now. For another take on the classic VU meter, take a look at this design based on an Arudino instead.


Very kind review thank you! ( The electronic engineer, me…) For those interested…on my youtube channel you’ll find more open source spectrum analyzers.
Everybody pumps out these software EQ’s. But you never see them actually tested with a freq generator along with amplitude for each bin.
Yes mike, I hear you. I did test it but I didn’t include it in the video. You can take my word for it or you can build it and test it :-)
I did watch another video of yours where you did do that. But everyone does just one tone at a time. I would like to see someone really test the code by injecting 2 or 4 freq. mixed to see if those 2 or 4 bands only pop up.
Easier basic tests than that.
Just use the pink noise generator built into most modern amps. Turn the room tuning on and off and observe.
All the spectrum analysers I’ve seen (that are FFT based) are linear frequency binned, or occasionally multiple bins are combined to make a more natural logarithmic display.
Of course ‘old time’ spectrum analysers were a set of analog filters, but were complex, expensive, and not real accurate (without excessive tweaking).
Has anyone played around with a constant-Q-transform to do logarithmic spectrum analysis in the digital domain?
About VU meters, PPM, etc, are their ballistic responses actually good for monitoring, or do we replicate them in software only because sound engineers are familiar with them? I’ve also seen bar displays with an extra line that decays slowly, perhaps to make clipping easier to see.
I don’t know what mean to imply by “ballistic response”, but a good analog meter will be very nearly critically damped: The needle will follow the actual value as quickly as possible, but won’t overshoot (or not by more than a few percent) and definitely won’t oscillate or ring.
A “real” VU meter will have very specific acceleration, damping, and decay characteristics. It’s not the case that any meter with a scale that looks like that is a “VU Meter”.
This is true.
But if you haven’t given LUFS a try, you don’t know what you’re missing. VU meters were great for tape, and when processing power was scarce. Modern LUFS meters/displays give you a lot better picture of what your audio really sounds like.
IMO, etc.
I don’t know. But a VU meter is standard. So it requires those specs, whether it was based on the inherent design of meters at the time, or not.
There wss lots of consumer equioment that had “VU” meters, but actually didn’t meet the specs, or allow for proper.measurement.
Aw the Teensy’s are gone : (
teensy is god idea, but why sd card not host usb A (or c)
many projects need more ram, why i cant upgrade ram? not increase but upgrade or 2 version
Adding features means losing the “gumstick” profile. The Teensy has so many IO pins, some are surface pads instead of edge connections.
Adding more parts either eliminates pads, or needs a bigger board.