Computers and digital sensors have allowed for the collection and aggregation of data barely possible to imagine to anyone in the instrumentation scene even sixty years ago. Before that, things like weather stations, seismometers, level sensors, and basically any other way of gathering real data about the world would have been performed with an analog device recording the information on some sort of spool of paper. This was much more tedious but the one thing going for these types of devices was their aesthetic. [mircemk] is back to bring some of that design inspiration to a digital barometric display.
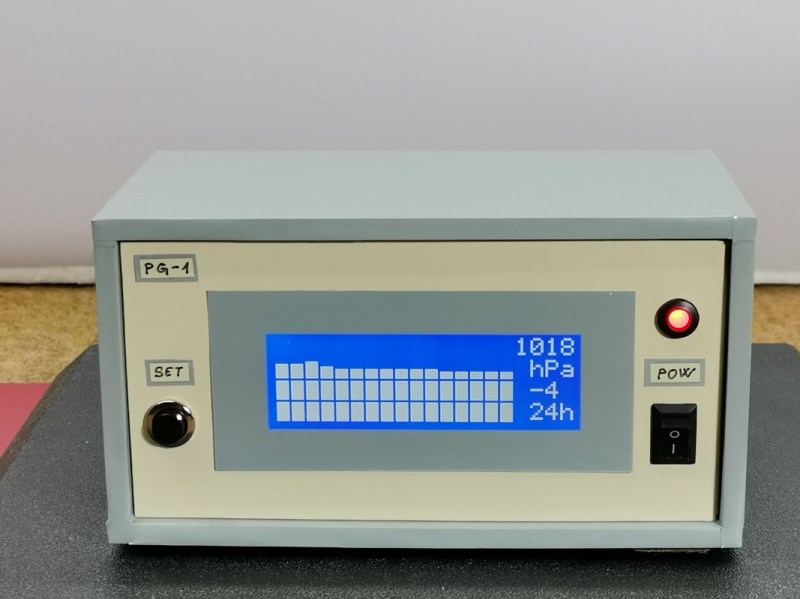
The barometer is based around an Arduino Arduino Nano and a relatively large I2C display to display the captured data. It also uses a BME 280 pressure sensor board, but the technical details of this project are not the focal point here. Instead, [mircemk] has put his effort in recreating the old analog barographs, which display barometric data on a spool of paper over time, on the I2C display. As the device measures atmospheric pressure, it adds a bar to the graph, displaying the data over time much as the old analog device would have.
We’ve discussed plenty of times around here that old analog meters and instrumentation like this recreation of a VU meter are an excellent way of getting a more antique aesthetic than is typically offered by digital replacements. Adding in a little bit of style to a project like this can go a long way, or you can simply restore the original antique instead.


This is a very nice idea. I will mention the drums usually held 7 day charts. And it would be nice to have options for pressure in inches and mm of mercury. This was an important reference because anyone anywhere could make a mercury baraometer from a glass tube and some mercury and with a little sliding vernier scale they could be read to a fraction of a mm. I think to at least +-10Pa and maybe +-5. So recording barometers that use a diaphragm or metal “accordion” could be calibrated easily. (1mm of mercury is 133.32 Pascals. The P in STP is 760mm or 101.3kPa)
I wonder could the author read the sensor and save data about once a second to look at later on a phone or computer? There is some interest in “microbaroms” or barometric waves that happen much faster than weather. Could be interesting :-)
One of the hospitals I rotated through had a funny looking coat hook; on closer inspection it was a vernier barometer that was used to calibrate the anestheisa vaporizers long ago. I was really surprised that it was both still there and not broken after all those years. I quickly figured out how to use it. There was a fine screw attached to a needlepoint that you adjusted until the needle tip just touched the surface of the mercury pool at the bottom. Then you just read the pressure off the vernier. It still worked perfectly and I think I was first person to use it in a century or something.
I have that on a Radio Shack Time and Weather Station #63-856 from the 80’s. Old school dark scale LCD showing Time, Inside Temp, Barometer Bar Chart, and weather icon predictions. Runs on 3 AAA batteries for about a year or so.
It’s called a barograph. I built one using an Arduino 2560 and a TFT LCD from Adafruit. There’s code on the web that has been through a bunch of people, the latest being Werner Kurzbauer. There’s a thread here: https://forums.adafruit.com/viewtopic.php?f=25&t=68552
Oh, and re: restoring the original antique…that’s what first attracted me, but then I started thinking about winding it every week, buying and replacing the paper charts, and using the eyedropper to add ink to the pen, and decided that building an Arduino version was a lot easier! I have mine down in my workroom, and have added touch points on the screen to change X (time) and Y (pressure) resolution/range. I can look at intervals ranging from a day to 32 days, and pressure range from either 28 – 32 inHg or 29 – 31 inHg.
some of the oldest weather records were aquired useing a crystal ball,with a holder for a calubrated paper strip
as a day would progress the sun or lack of it would leave
a burn that was directly proportinal in size to the suns brightness at that instant
there are hundeds of years of such daily data that are now
bieng incorporated in weather modles of the past,other things like shipps loggs are also bieng sieved for weather
data,especialy for things like sea ice
It’s called a Campbell-Stokes sun recorder and you can look at one and see the paper recordings at the Blue Hills observatory south of Boston:
https://bluehill.org/climate-weather/observatory-climate-data/
https://www.sciencefriday.com/articles/picture-of-the-week-sunshine-recorder/
They say they’ve been running it since 1886.
It’s really awesome to see.
I have an odd idea on how to expand on this, along the lines of the old paper barographs. Use a magnetic “pen” (for want of a better word) on an 8 track or other low density tape loop with a tape viewer like the one in this video by Techmoan https://www.youtube.com/watch?v=aZOxn8ggX8w
You could use the tape and viewer as a visual buffer of measurements, and by keeping a separate digital buffer, you could let the digital screen display the exact measurement of the time-position under a cursor central to the visual. But with a “pen” and eraser on both sides you could scan forwards and back and it would draw the barograph out of the digital buffer without consuming any ink or paper.