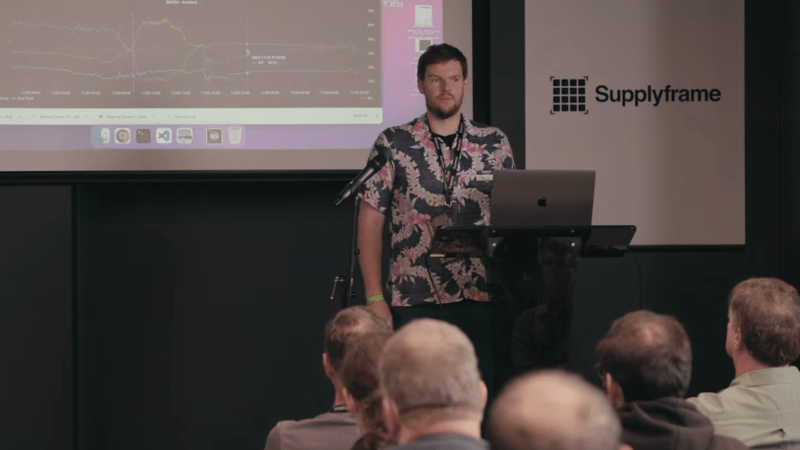
If you build your own devices or hack on devices that someone else has built, you know the feeling of opening a serial terminal and seeing a stream of sensor data coming from your device. However, looking at scrolling numbers gets old fast, and you will soon want to visualize them and store them – which is why experienced makers tend to have a few graph-drawing and data-collecting tools handy, ready to be plugged in and launched at a moment’s notice. Well, if you don’t yet have such a tool in your arsenal, listen to this 16-minute talk by [Alex Whittemore] to learn about a whole bunch of options you might not even know you had!
For a start, there’s the Arduino Serial Plotter that you get for free with your Arduino IDE install, but [Alex] also reminds us of the Mu editor’s serial plotter – about the same in terms of features, but indisputably an upgrade in terms of UX. It’s not the only plotter in town, either – Better Serial Plotter is a wonderful standalone option, with a few features that supercharge it, as [Alex] demonstrates! You don’t have to stop here, however – we can’t always be tethered to our devices’ debugging ports, after all.
With this in mind, [Alex] reminds us all about platforms like Tasmota and HomeAssistant that bring datalogging and graphing to our fingertips, and he shows us us how easy it is to set up a filament drying monitor with these, spending hardly any time on software and yet getting all the features we could wish for. With these platforms, it’s never been easier to build cool things quickly, to the point you can spend about an hour and build something that will then serve you years – and Grafana is, perhaps, the ultimate platform when it comes to aggregating data.
[Alex] quickly goes over what you need to install Grafana, and then shows us why you want to install it – with Grafana, collecting data from myriad sources becomes a breeze and a satisfying goal by itself, and you end up learning things you would never learn otherwise. He shows us some examples – for instance, by feeding battery voltage data from his sensor, he could figure out that one of them has a noisy power supply. Collecting RSSI data while querying your wireless sensors can be useful for tracking down sources of interference.
Whichever goal you’re pursuing with your device, there’s a little bit for everyone in Alex’s talk – you should check it out to be prepared for the next time you’re looking at a serial terminal with numbers scrolling by, thinking of the best way to wrangle these numbers into a graph!
And speaking of Supercon, get your tickets already!


+1 on the greatness of granada
A good companion is influxdb to store the data…
This is the first time I’ve heard of storing data in a well.
It’s the latest thing. All the kids are doing it.
Just curious [Alex], is that a Batik shirt you are wearing?[1] I am a native-born anglo-American, but lived and worked many years in Indonesia.
1. Batik – Wikipedia
https://en.wikipedia.org/wiki/Batik