How would you go about identifying usable land that suits your building tastes? [Scott Sexton] was specifically looking for land that’s not too steep to build on, and realized that existing resources didn’t easily offer him this information. He thus dived into the world of GIS to try and solve this issue for himself.
[Scott] hoped that USGS maps might provide the information he needed, but found they lacked grade information, only presenting elevation and topographic data instead. From past experience reading such maps, he knew that seeing a lot of topographical lines close together tended to indicate steeper areas, but wasn’t sure on how to actually get the computer to parse this and spit out the information on steepness and grade that he wanted.
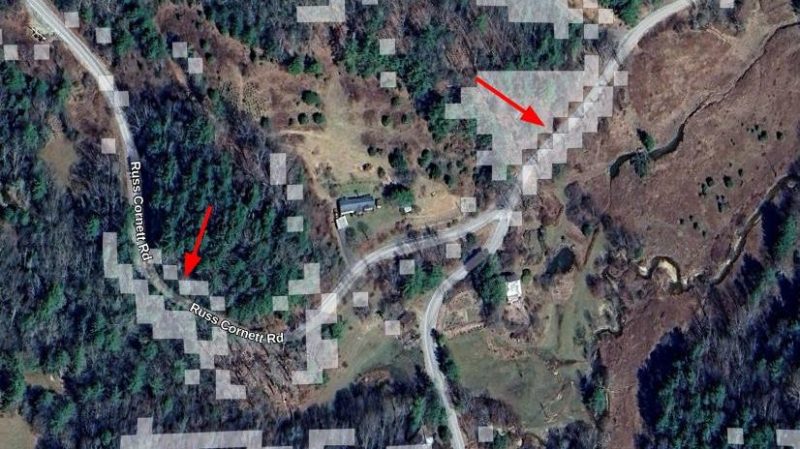
Ultimately, he set about downloading USGS elevation data in three-meter resolution. He then applied some calculus to determine the rate of change of the slope across areas of the data in order to mathematically find what he was looking for. Namely, flatter areas that would be more suitable for future construction. He then took the work even further, tweaking the output of his tools and automating until he could quickly and readily generate usability maps of areas of interest. He was even able to sanity-check his work by verifying that it correctly identified roads as obviously flat areas.
If you’ve ever tinkered with GIS work, [Scott’s] usability project may be of some interest. We’ve also seen amusing examples of what can go wrong when digital mapping data is used without sanity checks. Meanwhile, if you’ve got your own GIS hacks on the go, don’t hesitate to notify us via the tipsline!


“that’s not to steep to build on”
Really?
They would never approve new construction here on these nice places. Changing land planning is connected with insane bribes only developer corporation can provide here in Czech Republic.
easily
As it is everywhere.
I wonder how much effort the author spent on searching existing tools. Slope calculation is pretty standard GIS operation, and available in most open source tools (and presumably in arcgis). For example
https://grass.osgeo.org/grass-stable/manuals/r.slope.aspect.html
https://gdal.org/en/stable/programs/gdal_raster_slope.html
I remember doing this type of operation in the second week of my Intro to GIS class. Interesting explanation of how he gets there, but yeah definitely not a novel use of GIS.
And probably just a few clicks in QGIS, if you can find it among all the menus ;)
Probably he just used the tools he was already familiar with.
Just look at the density of the contour lines. Draw more of them at smaller intervals in a darker colour. Done.
LIDAR maps(and other sensor products) are a thing and freely available… not to mention much more accurate than legacy topo maps. They natively provide elevation data numerically; much more suited for machine parsing.