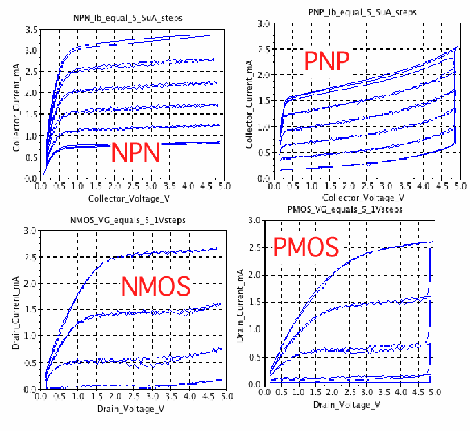
Wanting to test the response curves on some analog parts, [Don Sauer] devised a way of using simple tools to graph analog tests on a computer. Here you can see the results of testing NPN, PNP, NMOS and PMOS transistors, but modifying the input circuitry would let you test just about anything you want.
[Don] is using an Arduino as the hardware interface. He needed some additional parts, like an op-amp and some passives. Instead of building this on a breadboard, he printed the circuit out on a piece of cardboard, hot glued the components in place, then wired them up. This will let him reuse the interface in the future, but is quicker than designing and etching a PCB.
He uses a Processing sketch to capture the test data streaming in from the Arduino. Once recorded, he uses SciLab to create the graphs. He also covers a method of sifting through the data using Octave, another open source program that feels somewhat like MATLAB.


You’ve done C, do you think you can do MATLAB???
Matlab? Really? Why?
This sort of thing SHOULD be done in C.
Tweeks
Well, matlab can do things like frequency analysis without having to do complex math in C.
OK, I see a link to a picture…where’s the project?
/I dont snoop around on sites by guessing whats in the root folder; dangerous.
when you click link, you get correct page,not only img
MATLAB should be fairly easy to implement, but I doubt the maker would rewrite his entire code in MATLAB unless he really needed to. That’s a lot of effort. But no doubt about it, MATLAB is really handy for processing data.