When you think of art, you might think of portraiture, landscapes, or other kinds of paintings. But mathematics can feel artistic at times, too. We’ve all seen gorgeous Mandelbrot fractals, and less gorgeous Julia fractals, but that’s not all that’s out there. As [Prof. Halim Boutayeb] demonstrates, Maxwell’s equations can show us some real beauty, too.
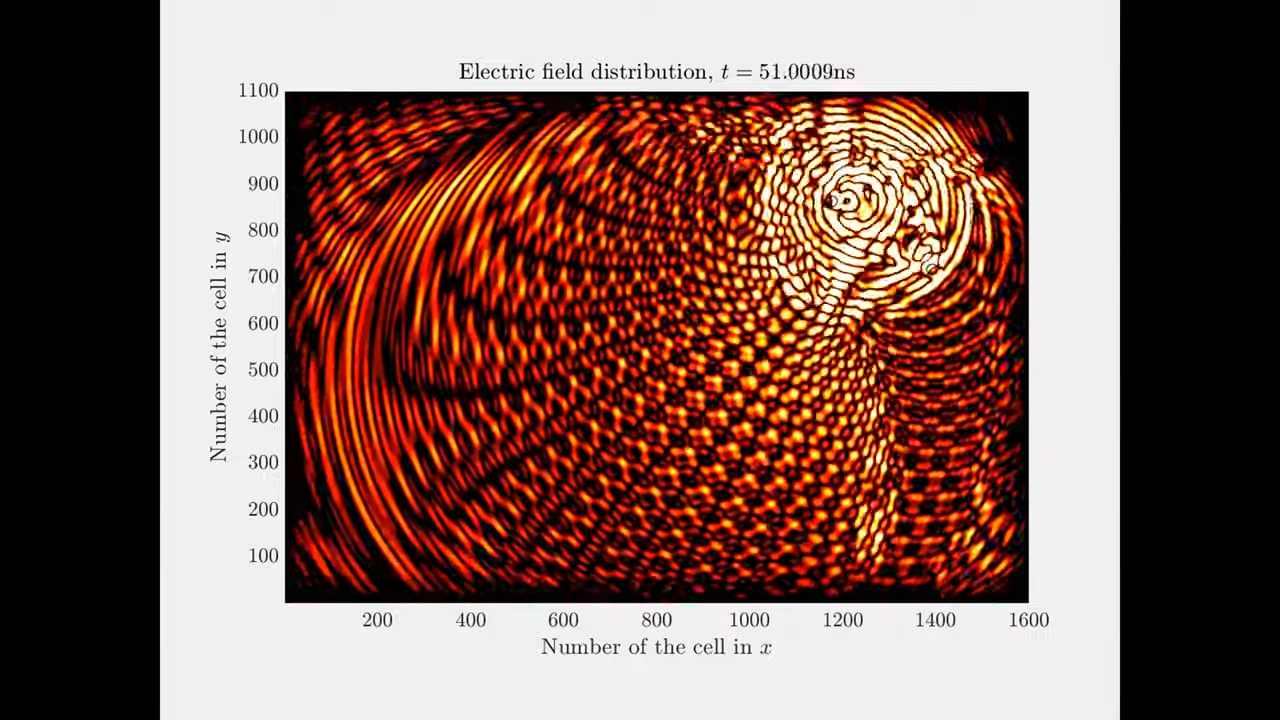
The work involves running simulations of multiple electromagnetic sources moving, bouncing around, interacting, and so on. The art comes in the plotting of the fields, in warm colors or just outright rainbows. The professor does a great job of pairing some of these videos with pumping electronic music, which only adds to the fun.
Of course, the colors are pretty, but there’s a lot of valuable physics going on behind all this. Thankfully, there are all kinds of additional resources linked for those eager to learn about the Finite Difference Time Domain method and how it can be used for valid simulation tasks.
Throw this kind of stuff on a projector at your next rave and you will not be disappointed. Video after the break.