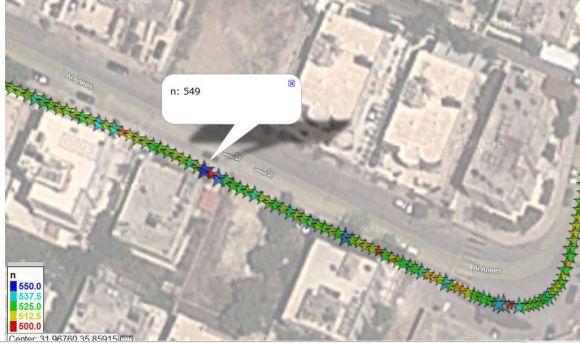
Now you can prove that you have the bumpiest commute in the office by measuring how rough your ride actually is. [Techbitar] calls the project the Bump-O-Meter. It uses an Arduino, GPS, and accelerometer to map out rough roads.
The hardware was built on a breadboard and [Techbitar] goes into detail about connecting and communicating with each module used. Once it’s running, the logger will read up to six sensors and record them to an SD card. In the video after the break he shows the method used to dump and graph the data. He starts by looking at the data in a spreadsheet. There are many fields included in the file but only three of them are needed to graph what is seen above. After narrowing down the number of columns he heads over to GPS Visualizer and uploads the data set which is then automatically plotted on the map.
In a Utopian society all city owned vehicles would have a system like this and the bad sections of road would automatically appear on the road crew’s repair list.


Very cool. If you could get this into every car and have the data correlated then it could be sent to whichever authority deals with potholes and they’d know exactly which ones are the most encountered!
http://www.boston.com/news/local/massachusetts/articles/2011/02/09/weapons_in_the_battle_vs_potholes/
+1. They had it on Innocentive. Boston city using mobile phone app to detect all potholes in city .
You all belong to that right ? http://www.innocentive.com/
Good God! That’s a car trap not a pothole :(
Interesting idea, although I doubt much would be done with the information…at least on many of the roads I travel. It’s not rare for me to hit spots where stuff flies 2 feet up and the seat belt is the only thing holding me in the seat, and that’s at 15MPH. I might considering building one of these, but I know that a breadboard version wouldn’t last very long.
it would be very easy to build a PCB version of this.
I would have used a mobile phone. It already has all the sensors and processing required for this.
That’s what I was thinking. Is it difficult to poll for sensor data either in an app or across USB?
exactly my thoughts! one of the reasons why I got an android phone – because they are damn cheap and have like tons of sensors and computing power… some mobiles are cheaper than wifi shields for arduino
Nah, in a Utopian society we would have flying cars. No such thing as air potholes….
Would turbulence be considered a pothole?
Yes, any change in movement up/down, sideways, forward/reverse can be tracked
“all city owned vehicles would have a system like this and the bad sections of road would automatically appear on the road crew’s repair list” Seriously, great idea! Why hasn’t anyone done this yet?
I tried :( but no luck.
Never work here, there’s not enough storage in the world so save the locations of all the potholes!
LOL! So you just reveres the system to track only good road sections instead of potholes :)
its a nice idea but the problem is i think standard stop and go traffic, acceleration, breaking, turning, car jiggles EXC would cause false readings
stick this on a suspicionless go-cart and i think we have a project XD plus something fun to do!
Even in stop and go traffic, you can develop simple algorithms to space out your readings based on data provided by the GPS such as location, speed and time of reading. Multiple readings with similar latitude/longitude at slow speed (all of this captured by the GPS receiver) means you are reading data over a very short stretch or while stopping. As for car jiggle, the accelerometer reads X, Y axis data (sideways/forward/back) along with Z data (up/down). So you can isolate the direction of the shakiness easily. The raw data contains a wealth of info that can be used to improve accuracy under most conditions.
You’re totally right about the x/y/z separation. However, I think it’s more thorough to say that the pothole bumps will be mostly in the opposite direction of gravity. If you put your phone in a cup holder or something, it could be angled so that the pothole bumps show up in all three axes, so calculating it against a gravity normal might be more robust than assuming everything will be in a predefined single axis. I think what I’m saying is the same as what you did, but abstracted for different orientations for wherever/however the sensor is oriented.
my 2¢
xef6, your thinking is correct. What I am hoping to do is to simplify the process by avoiding too much math. The geo data logger does capture all x,y,z axis readings so it’s possible to get a more 3D reading of road conditions by obtaining a “profile” of a pothole or bump in all 3 axis then use that as a frame of reference. Also good point about the effect of a bump on the sensor. Yet the geo data logger does not care if the bump is in the opposite direction of gravity or not, it will generate raw readings that you “profile” and interpret for each abnormal and normal road situation. So if an “average” bump generates 500 in the z-axis and a pothole generates 540 on average in the z-axis while a smooth road generates 520 then these values become your profile for bumps and potholes and good road. Change in sensor orientation could change these numbers.
Hi Guys, Thanks for the feedback. I considered doing this Bump-O-Meter with a smart phone too, the kind with built in accelerometer and GPS. But at this stage, it was much simpler to build it from basic components. The programming was nominal. My next version of this may include an internet upload-to-hub feature to collect from multiple Bump-O-Meters into a central geo-database.
I always imagined that a similar system could be used for classifying bicycle tracks automatically. Think of an OSM routing app on you phone/gps that feeds back the quality of the current road.
For the next trip there would be the option of selecting a road type: paved road / potholes / gravel / cobblestone / dirt road.
i’d also add gps bike navigation, selecting the best rout to go based on slop angle and your riding statistics. selecting the easiest / hardest / fasts rout to your destination.
I suggested this in a hackaday comment, and a week or so later it shows up as a project..
But I’m used to not getting credit by now so it’s all OK, plus we are all hack pals aren’t we so we don’t mind sharing.
Whatnot, The designer of this project is not making any money out of it and he has published it as an open source project for anyone to benefit from without having to pay a penny. So try saying thank you at least. It’s very impolite if not downright unethical to make such an accusation if you are unable to back it up. So at least have the decency to show your real name and post a link to your design with proof of date of creation. Even then, the idea of using accelerometers to measure surface disturbances is not original. It’s as old as accelerometers themselves. So just because you thought of it, it does not make you the first. Next time, a genius such as yourself should keep his ideas to himself.
Here in New England the map would be solid red on every street.
I met people in Las Vegas who had never heard the phrase pot hole.
You mean green not red :) Red and blue are indicators of abnormal road conditions. Green means closer to 1g which is normal gravitational pull which is normal condition.