Arduino Data Logger Maps Out The Potholes On Your Morning Commute

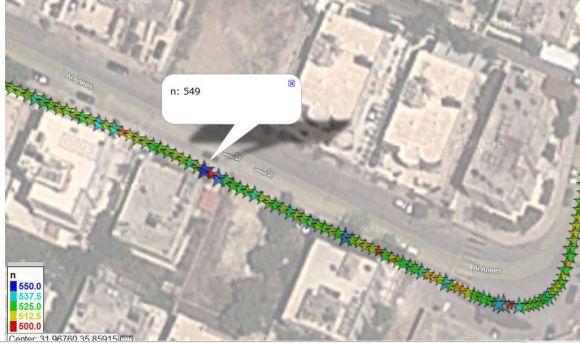
Now you can prove that you have the bumpiest commute in the office by measuring how rough your ride actually is. [Techbitar] calls the project the Bump-O-Meter. It uses an Arduino, GPS, and accelerometer to map out rough roads.

The hardware was built on a breadboard and [Techbitar] goes into detail about connecting and communicating with each module used. Once it’s running, the logger will read up to six sensors and record them to an SD card. In the video after the break he shows the method used to dump and graph the data. He starts by looking at the data in a spreadsheet. There are many fields included in the file but only three of them are needed to graph what is seen above. After narrowing down the number of columns he heads over to GPS Visualizer and uploads the data set which is then automatically plotted on the map.

In a Utopian society all city owned vehicles would have a system like this and the bad sections of road would automatically appear on the road crew’s repair list.

Continue reading “Arduino Data Logger Maps Out The Potholes On Your Morning Commute”

Data Plotting For The Visually Impaired

This setup helps to represent data in a meaningful way to for visually impaired people. It uses a combination of physical objects to represent data clusters, and audio feedback when manipulating those objects. In the video after the break you’ll see that the cubes can orient themselves to represent data clusters. The table top acts as a graphing field, with a textured border as a reference for the user. A camera mounted below the clear surface allows image processing software to calculate the locations for the cubes. Each cube is motorized and contains an Arduino and ZigBee module, listening for positioning information from the computer that is doing the video processing. Once in position, the user can move the cubes, with modulated noise as a measure of how near they are to the heart of each data cluster.

The team plans to conduct further study on the usefulness of this interactive data object. We certainly see potential for hacking as this uses off-the-shelf components that are both inexpensive, and easy to find. It certainly reminds us of a multitouch display with added physical tokens.

Continue reading “Data Plotting For The Visually Impaired”