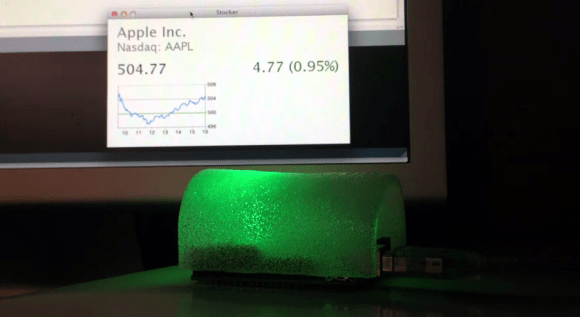
If you can’t help but spend the day checking in on your stock prices this ambient device can help you cope. It monitors how the trading is going and illuminates an LED as feedback. Here the Apple stock is trading up so the light is green. The video after the break shows other stocks trading down, causing it to switch to red.
An Arduino interfaces with the custom application via USB. For now it looks like the two colors are all it’s capable of but we think there’s a lot more potential. Some creative coding could use factors like how much the stock has moved, trading volume, volatility, or a plethora of other data to give feedback. We could see a spectrum of colors (like on a temperature map) used to improve the level of feedback. And if the market really tanks there’s always the ability to add flashing!
The diffuser for the project is quite interesting to us. [Ali Reza Kohani] made it from a leftover scrap of acrylic. The bubbled surface was created with a heat gun before bending the sheet into an arc.


Hey, that screen shot is out by about -11%! :D
I told my parents to buy some Apple stocks when they where at $78. They didn’t listen.
no
I’ll be posting the code and a tutorial on how to build one soon.
If all you look at is rising /falling price, all you need do is: make a list of your favorite stocks, and cycle through them. Some people, however, use indicators like EMA or MACD. For them, you will need a little more processing power (and price/volume history).
Exactly. http://www.google.com/ig/api?stock=AAPL has some Volume data. Calculating your own stats shouldn’t be too much of an issue in this type of setup since all the heavy lifting is done on the computer.