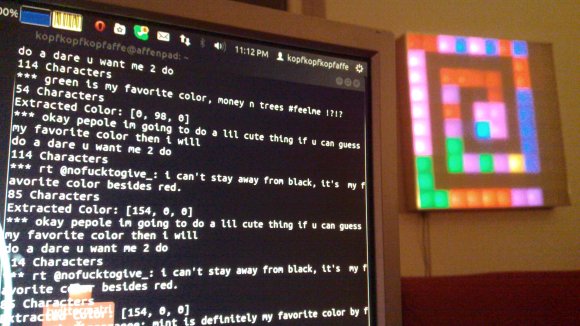
What’s your favorite color? Don’t tell us, Tweet it to [Sebastian’s] favorite color Twitter display and you’ll be contributing to the artwork hanging on his wall.
This answers a very important question, what do you do with your projects after they’re completed? For us the best part is the planning and building. Once it’s done the thrill is pretty much gone for us. We haven’t even switched on our Ping Pong clock in over a year. But [Sebastian] recently dusted his 10×10 LED matrix for this project.
Tweets are parsed by a Python project he wrote to try out the Twitter API. It looks for a set list of colors . He asserts that people aren’t that creative when you solicit their favorite color but to prove him wrong we’re going to say our favorite is Amaranth. After it finds the color it pushes it to the next pixel in the spiraling pattern shown above. But wait, there’s more! To give the pixels a but if extra meaning he uses the total length of the tweet to set intensity.
If you need a Titter enabled hack that displays a bit more specific data you’ll want something that can actually display what was Tweeted.


“To give the pixels a but if extra meaning he uses the total length of the tweet to set intensity.” – I think you meant bit of extra meaning.
“If you need a Titter enabled hack that displays a bit more specific data you’ll want something that can actually display what was Tweeted.” – I think you meant Twitter.
Feel free to delete this comment if you decide to make the corrections, I’m not trying to be a smart ass; just trying to help.
Keep up the good work!
“Titter enabled hack” – I love that one!!
how long before there’s a tumblr with that name… lol.