Bathymetry is the underwater equivalent to topography. And with the right map data, you can make some amazing 3D laser cut maps that feature both land masses — and the details under the sea. [Logan] just learned how to do this, and is sharing his knowledge with us.
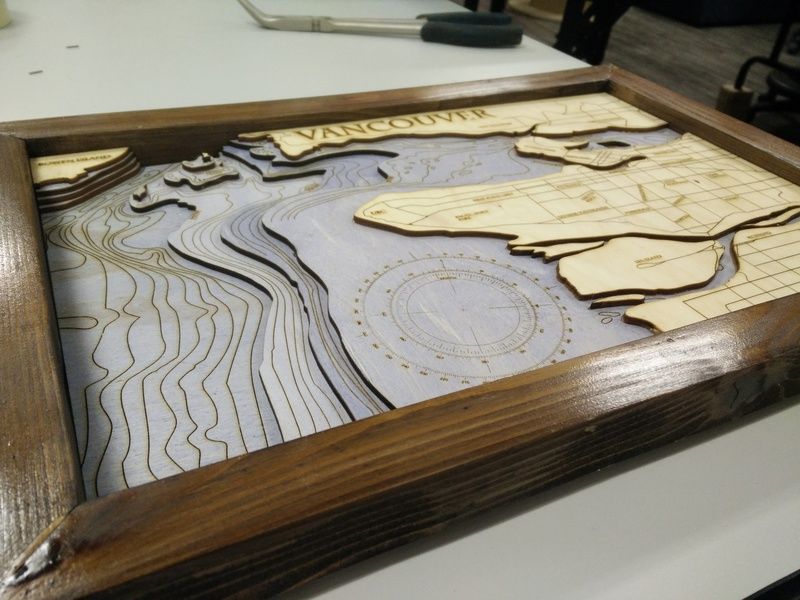
[Logan] holds the typical hacker belief: The best way to learn something is just to start the project and figure it out as you go. Which also makes him an excellent candidate for helping others to learn what not to do. His goal of the project was to create a visually stunning map of Vancouver that helps to emphasize the depth of the ocean just off the coast.
To do this he obtained bathymetry data from the Fisheries and Oceans of Canada, and city map data from Open Street Map, a service we’re very familiar with that has provided data for many cool hacks, like this Runner’s GPS unit. The tricky part now is combining the data in order to laser it.
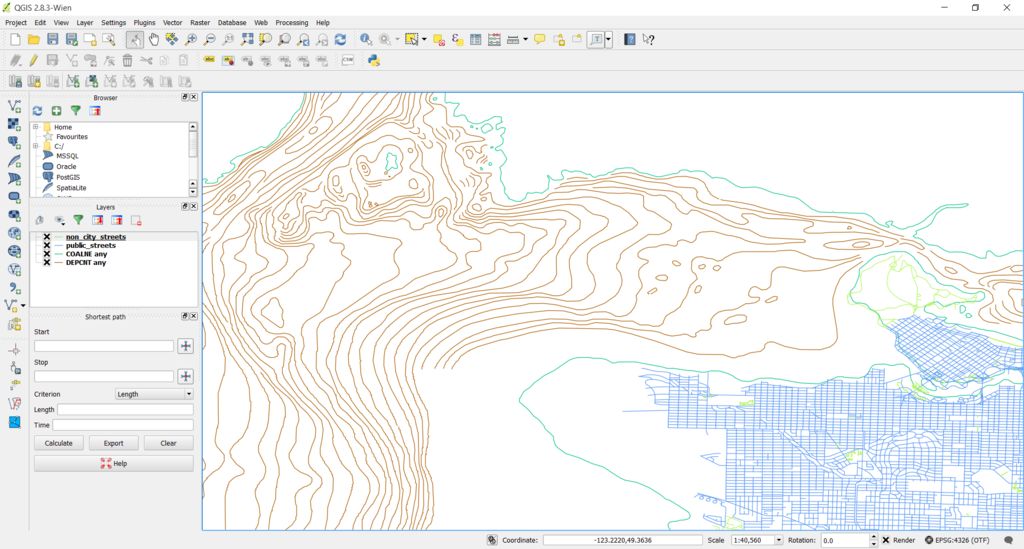 Enter QGIS, a free and open source geographical information system that allows you to edit and combine map data, and the best part — export to .dxf.
After he was happy with his new map file, it was time to get cutting. This will be pretty tedious depending on how much detail you decided to use, but the end result is oh so worth it.
Once it was all done, he also stained the ocean layers blue to give it more depth — if you wanted to get really creative, you could also do a dyed blue epoxy fill which would allow you to still see the detail — but look like water!
For more information on how to make laser cut maps of your city, check out this other project we covered last year — funny enough — also based in Vancouver.


I asked on the Instructable, but I’ll ask here too. Does anyone know how to get similar bathymetric data for the UK? Last time I looked I could find anything.
I’ve never looked for UK bathymetry, but you can try: http://www.gogeo.ac.uk/
NOAA (USA) is supposed to compile this sort of data, too).
I am not sure where to get it for free however the UK Hydrographic Office has the data. http://www.ukho.gov.uk/
Someone on Instructables has now pointed me to http://www.bodc.ac.uk which looks promising.
At a lower resolution (30-arc-second-per-pixel), GEBCO has global bathymetric data — https://www.bodc.ac.uk/data/online_delivery/gebco/ — and you can download it for free. On the map on that page, shift + left drag over the extent of the UK seas you want data for… it’s all pretty boring and flat unless you include the shelf on the bottom right :) Then I would suggest selecting “User-defined area or global grid” in 2D netCDF format — especially if you’re gonna be looking at this in qgis. Fiddly “data portal for scientists” website but after 30 minutes of messing around with broken forms you’ll get the data.
Higher res stuff probably here
https://www.gov.uk/guidance/inspire-portal-and-medin-bathymetry-data-archive-centre#bathymetric-surveys—file-formats
but couldn’t figure out how to download it using their weird map interface, seems to be broken…
Put some legs on this ASAP and have a super rad coffee table!
Is anyone aware of where I can obtain similar files for the Florida Keys and St Petersburg Fl that are complete and ready to laser cut? Thanks