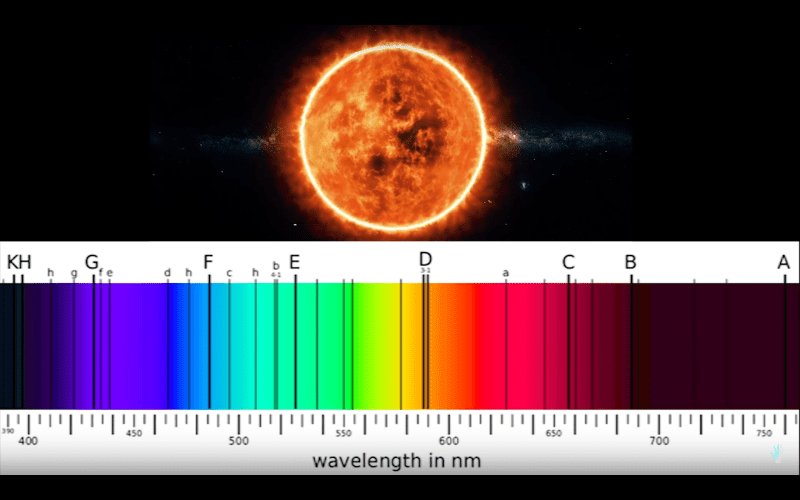
We know the effect of passing white light through a prism and seeing the color spectrum that comes out of the other side. It will not be noticeable to the naked eye, but that rainbow does not fully span the range of [Roy G. Biv]. There are narrowly absent colors which blur together, and those missing portions are a fingerprint of the matter the white light is passing through or bouncing off. Those with a keen eye will recognize that we are talking about spectrophotometry which is identifying those fingerprints and determining what is being observed and how much is under observation. The device which does this is called a spectrometer and [Justin Atkin] invites us along for his build. Video can also be seen below.
Along with the build, we learn how spectrophotometry works, starting with how photons are generated and why gaps appear in the color spectrum. It is all about electrons, which some of our seasoned spectrometer users already know. The build uses a wooden NanoDrop style case cut on a laser engraver. It needs some improvements which are mentioned and shown in the video so you will want to have some aluminum tape on hand. The rest of the bill of materials is covered including “Black 2.0” which claims to be the “mattest, flattest, black acrylic paint.” Maybe that will come in handy for other optical projects. It might be wise to buy first surface mirrors cut to size, but you can always make bespoke mirrors with carefully chosen tools.
Aluminum tape is used to make the slit for passing the rainbow since it must have clean edges to let in the smallest sliver of light with no blurring, but this arrangement can always be upgraded to a pair of moveable razor blades. The laser cut edges are not clean enough or narrow enough. The diffracting material should be purchased since it is cheap and easy to find, but in a pinch, an unpainted CD will do the trick.
Theremino software is the weapon of choice, and a demonstration shows that a green laser pointer has a sharp spike in the green range and an additional peak in the infrared range. That is good news if you need an IR laser that you can also see in the visible spectrum. [Justin] covers some of the tests he plans to do, including quantifying DNA, and shows how inexpensive spectrometers can measure presence and saturation.


I am fancying for a DIY-build of a spectrometer of VIS and continuous down to below 300nm (possibly down to 200nm; no interest in IR) but, as a Noob in optics, I am having a hard time in selecting diffusion grating, prisma material and sensors.
Any advice here, please?
I am aware that I may need multiple sensors in order to cover all the range of my dreams, in particular if I want to stay in reasonable low hobby price range…
Nice Intro, OptoNoob… But as your Sr in NoobNess, I request uou flesh it out a bit more. I’ve worked w IR reflective, UV passing mirrors and frist reflective mirrors and optics w 75-1200 w arc lamps, but the topic is of broad interest. Expading to IR &/or UV later us optional but also interesting. Carry on, if you please. It will bridge for me, that with which the noobless will soon follow. Thx!
Quarts for prisms and optics. Reflection grating for same reason. Why not modify an old used monochromator? Or get the grating from one.
I’d love to have quarts of prisms and optics!
for the best resolution and signal-to-noise, you want a aberration corrected concave grating, the cheapest are from china (try dropping the aberration corrected when you search) here’s a link to one that seems super cheap https://www.alibaba.com/product-detail/Factory-offer-holographic-concave-grating-30mm_60738387510.html
This is a cool build of a spectrophotometer but I don’t see any way of standardising and calibrating the path length. Did I miss it? There was a lot of general science tuition that diluted the build for me.
Also describing a diffraction grating as a series of tiny prisms. Outch. Not literally wrong in a transmission grating of course but massively misleading in terms of function.
remember, the path length is only where the light traverses the sample… in a nanodrop (which he said this build was modeled after), it’s a set-screw that stops a swinging arm from completely squashing a droplet of liquid… so likely you’d use some automotive thickness gauges, along with the diameter of the optical fiber (or aperture) between the sample and the detector (a nanodrop uses a fiber, looks like that build was just an aperture, but I skipped through the whole vid in like 30 seconds)
Excellent. My first use of a spectrometer, actually spectrophotometer, was with a Spectronic 20. I performed a lot of clinical chemistry assays with that nice little instrument. This build brings back fond memories. Thanks
Spec 20 is a bio-lab workhorse, but it is really a scanning monochromator IIRC. A single photo-tube detector and a grating that pivots as you turn a knob with a calibrated scale and what, a meter needle to read intensity? And don’t you to calibrate every time it warms up? I can recall the bio department calling for help quite often because they were “spilking” (which means not allowed to warm up) though sometimes the problem was the ON-OFF switch was in the OFF position or the power cord was not plugged in.
Using the camera here as a linear array is the modern equivalent of a spectrometer with a fixed grating and a strip of film that records the whole spectrum at once. I would guess a high precision one needs some good calibration or some special optics to compensate for the array being flat and not following the radius from the grating. Hmmm. That would be fun to do……
These Cenco (2 meter?) spectroscopes were in every college physics lab at one time. You can see where the slit is adjusted and the curved things are 35mm film holders. There is also an eyepiece that fits the same curved face that slides where you want. Gas discharge tubes are used as calibration sources. Linear arrays from scanners are in, well, old scanners :-) and are from And holographic gratings are small, precise, and cheap. This can be made really small. I have some NEC D3768D that are 7500 pixels in RG and B but I think monochrome is better. And they are CCD and can integrate.
It was over 40 years ago. I think it was by Bausch. Yes it had an analog gauge. Yes you used Dial to set the wave length. You zeroed the gauge with a water blank. Each run used calibration standards plotted on graph paper concentration vs absorbance. Unknowns were interpreted from the graph. Control samples were analyzed along with patient samples and plotted on Levy-Jennings charts and analyzed for drift or shifts. It worked for color producing assay reactions. But was sensitive to non-specific absorbing interference such as lipemia, hemoglobin, bilirubin etc.
That’s all done now in seconds with automated analyzers.
DId not paste the link I guess. https://www.flickr.com/photos/madatechhc/8471322211/in/photostream/
The only spectrophotometer popular enough to have its own Wikipedia article: https://en.wikipedia.org/wiki/Spectronic_20
(I’m just guessing—I haven’t looked for articles on other models, but I highly doubt there are any.)
It was over 40 years ago. I think it was by Bausch. Yes it had an analog gauge. Yes you used Dial to set the wave length. You zeroed the gauge with a water blank. Each run used calibration standards plotted on graph paper concentration vs absorbance. Unknowns were interpreted from the graph. Control samples were analyzed along with patient samples and plotted on Levy-Jennings charts and analyzed for drift or shifts. It worked for color producing assay reactions. But was sensitive to non-specific absorbing interference such as lipemia, hemoglobin, bilirubin etc.
That’s all done now in seconds with automated analyzers.
As anyone who follows South Park knows, this sounds very much like a Canadian Spectrometer. So YMMV if you’re not in Canada.