We’ve done quite a bit with Google Sheets and signal processing: we’ve generated signals, created filters, and computed quadrature signals. We can pull all that together into an educational model for two SDRs talking to each other, but it’s going to require two parts: modulation and demodulation. Guess what? We can do that with a spreadsheet.
The first step is to generate a reference clock for the carrier. You’ll need a cosine wave (I) and sine wave (Q). Of course, you also need the time base. That’s columns A-C in the spreadsheet and works like other signal generation we’ve seen.
The Plot Thickens
Think about the IQ plot of what we have so far. Plotting IQ means putting I on the X axis of a graph and Q on the Y axis. When I=1, Q=0. That’s a spot right on the X axis at X=1. The same thing happens, but flipped around when I=-1. It also happens when I=0 and Q=1, but rotated 90 degrees. The key is that, in each case, the length of the vector is 1. Every spot, in fact, will have a length of 1 because sin2(x)+cos2(x)=1. If you look at the first 12 rows of the spreadsheet with default values, you’ll see that X and the Y move between 1 and -1 in such a way that the sum of their squares is always 1.
What does that mean? It means the IQ reference signal will draw a circle of radius 1 on the IQ plot. If we multiply both by the same amount, the radius will change, but you’ll still get a circle. That’s AM or amplitude modulation. You can think about a few other things, too. For example, if I and Q were exactly the same (an easy change to make in the spreadsheet; just set both columns to the sine or cosine), the phase angle will always be 45 degrees or 225 degrees. and the amplitude would always be the square root of two (assuming the original signals go from -1 to 1). Multiplying both by the same number will change the amplitude of the signal, but not the phase.

Multiplying one part of the IQ by some number and not the other will cause a change in phase. Imagine the part of the graph where I and Q make a 45-degree angle — that is, I=Q. If you make Q bigger, it must change the angle of the vector. So by manipulating the reference IQ signal we can create amplitude modulation or phase modulation and changing phase can also create frequency modulation.
Put it to the Test
In real life, you might have two stations both using DSP techniques to transmit and receive. In that case, the transmitter generates a reference IQ signal, manipulates it, and winds up putting out a single RF signal to the antenna.
The receiver can’t know for sure if the sending station is using DSP or not, but it doesn’t matter. The signal is the same either way. The receiver will generate its own IQ reference signal and reverse the transformation. Sort of. The problem is, there’s no way to know if the transmitter’s reference signal is in phase with the receiver’s. However, the relative phases will be the same and that’s all you care about if you even care about the phase at all.
There’s one other issue. When you recover the signal it will ride with a higher frequency signal that you’ll need to filter out. Luckily, we already know how to do that.
In the Sheets
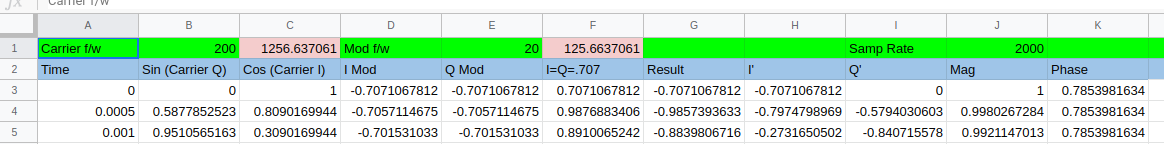
Here’s how to read the spreadsheet. The main tab is where most of the action is. You can set the usual parameters at the top. The first three columns are the time base and the IQ reference signal. I’ll cheat and reuse these on the receive side, too. If you wanted to prove it would still work if the reference signals were out of phase, you could easily make the modification.
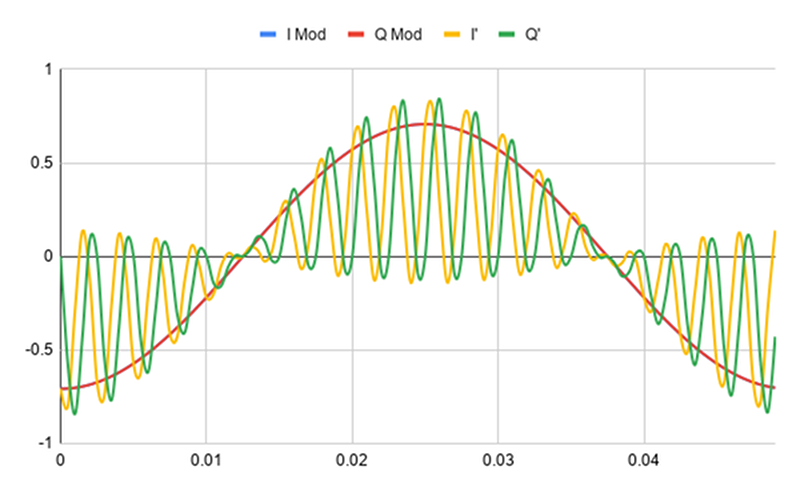
The rest of the columns up to column G are modulating the IQ reference. The resulting “radio” signal is in column G. This is both the output of the transmitter and the input to the receiver.
The receiver is in columns H and I because I reused the time base and the reference signal. If you look at the plot of the input signal and the output, you’ll see the high frequency component I mentioned.


Note that the modulating signal on I and Q are the same, so you only see the Q signal (the blue I signal is directly underneath it). Although you can see the low frequency matches the modulation signal, you can switch to the second tab to filter the high frequency component out.
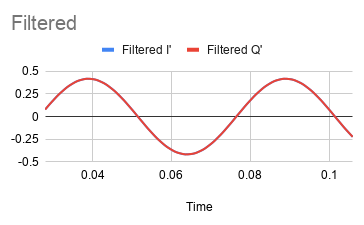 That sheet uses the FIR filter technique we talked about before. The filter has a passband from 0 Hz to 60 Hz and the stopband starts at 100 Hz. You can see a partial gain vs frequency plot. There are 57 taps, so we will miss the first 57 samples as the algorithm loads itself with data.
Of course, the filter shifts the phase of the signal and misses the first few samples, so the time axis doesn’t align, but that doesn’t matter. Without a synchronized IQ reference, there wouldn’t be any hope of phase alignment anyway.
Final Tab
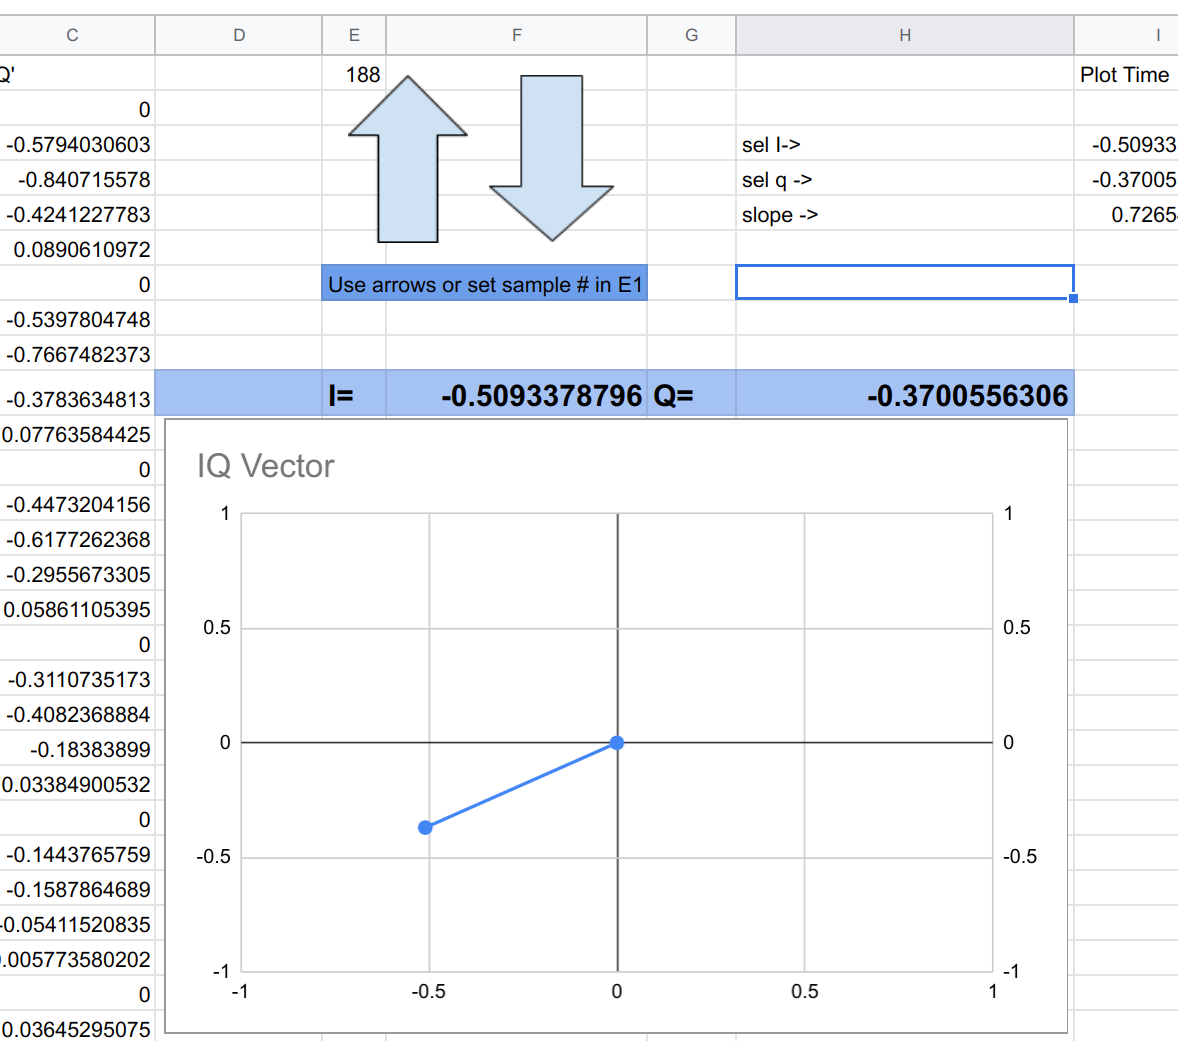
The final tab takes the data and allows you to do a vector plot against any of the samples. I cheated and used a script to enable the big arrow buttons, so you may have to grant permission before that will work. However, you don’t need the buttons if you don’t mind manually changing cell E1. It takes a little work to get the spreadsheet to make nice vector diagrams:
Honestly…
In a way, it is amazing you can do this much modeling in a spreadsheet. If you were serious, you should really think about using something like Juypter or — honestly — anything else. However, if you want to learn DSP concepts, having to learn a new tool first can be pretty daunting.
Using nothing more than a spreadsheet, you can use this model to think about what happens under certain circumstances. Once you outgrow it, you can move to something like MATLAB or any of the numerous clones of it, or tackle your code in C, Python, or whatever your language of choice happens to be.


0 comments, just thought I better reassure Al that he’s not talking to himself LOL
Tech articles like this dumping on a Friday tend to raise a collective sigh of Nooo… don’t make me use my braaain. Or at least I tend to bookmark them for those crisp clearheaded mornings.
#me_too
Audience too stuffed with turkey to waddle over to the computer to type something in.
That’s the nice thing: it will be here when you are ready. More to come, too.
My sentiments also, RW!
Interesting, I never noticed these spreadsheets before. I’m a newbie however. I was just looking at DOS and Powershell programming again since last left off with Bash. I was wondering about plotting with DOS actually… so is interesting having the last two months with only free WiFi while on the road to see this article appear. Was hoping to collect more “health attack/assault” signals and disclose online… though they keep attacking me with free or cheap shit, like garden tractors.
I think you’re gonna need to find a nice quiet state park campsite for a while and let the rhythms of nature wash it all out man, foliage blocks signal, and there’s no “background” emi for them to stealth it over.
I never did anything graphically with DOS… so still will be interesting to see about plotting and maybe dynamic plots with DOS too. Probably will look into plotting with Bash also.
Thank you for sucking another hour out of my life! I was looking for something else and ended up here, completely captivated. Over many years I have worked in the power electronics industry, analysing power harmonics etc. Although I had a vague idea of how power quality meters analysed a waveform to derive the individual harmonics, I had no clear idea of how this was achieved. Now I know, and what’s more, I see it’s something I could program too, using your examples/guidelines for a FIR filter.
Great article and well laid out. I’ll be back for more, that’s for sure. Thanks again.
Forgive my ignorance but I am not an engineer. I am a dumb guy who is interested in AM techniques for time series analysis on financial data. Is your spreadsheet done in the frequency or time domain? It seems to me this is time domain AM because in the G result column you are adding the product of the in-phase carrier and modulating waves plus the product of the quadrature carrier and modulating waves.
You may be interested in this book:
Rick Lyons “The Essential Guide to Digital Signal Processing (Essential Guide Series)” 2014
https://www.dsprelated.com/books/401.php
“The Complete DSP Guide for Businesspeople and Nontechnical Professionals”
Why are you using the same cosine wave for the I and Q modulating waves (columns D and E)? I have seen numerous IQ modulation diagrams that multiply a cosine modulating wave with the in-phase carrier and a corresponding sine modulating wave with the quadrature carrier and then sum the two products. Admittedly, the numbers seem to work from the look of your charts in the spreadsheet but I’m confused by this. BTW, thank you for producing this article and spreadsheet. They both go a long way in furthering my practical understanding of a somewhat complex topic. Great work!