
Every summer you go down the shore, but lately you’ve begun to notice that the beach seems narrower each time you visit. Is that the sea level rising, or is the sand just being swept away? Speaking of sea levels, you keep hearing that they rise higher every year — but how exactly is that measured? After all, you can’t exactly use a ruler. As it turns out, there are a number of clever systems in place that can accurately measure the global sea level down to less than an inch and a half.
Not only are waves always rippling across the ocean’s surface, but tides periodically roll in and out, making any single instantaneous measurement of sea level hopelessly inaccurate. Even if you plan to take hundreds or thousands of measurements over the course of weeks or months, taking the individual measurements is still difficult. Pick a nice, stable rock in the surf, mark a line on it, and return every hour for two weeks to hold a tape measure up to it. At best you’ll get within six inches on each reading, no matter what you’ll get wet, and at worst the rock will move and you’ll get a damp notebook full of useless numbers. So let’s take a look at how the pros do it.
Expensive Rulers
As it turns out, measuring sea level with a ruler isn’t that far off — but professional oceanographers have really nice ones called tide gauges, which live in aptly-named tide houses. The simplest tide gauge is a long tube sitting in the water, anchored in place. The tube has small openings below the water level that allow water to flow in and out. Also referred to as a stilling well, this device averages out small movements and waves, allowing for a much more calm and accurate measurement against a series of graduations inside the tube.
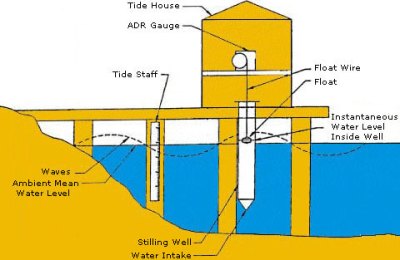
Of course, manually making all these measurements is tedious work, and today there are computerized methods for recording tide levels. Even so, some tide houses had automated recording systems as early as 1830. These systems consisted of a float in the stilling well, which moved a “pen” by way of rope and pulley. Every six minutes, the pen would mark the tide level on paper, much in the way an old seismometer works.
Over the years, the stilling well has evolved into the sounding tube — rather than a float on a rope, the sounding tube sends an audio pulse down the tube and measures the time it takes for the pulse to bounce off the water surface and return to a sensor. Recently, NOAA has developed a new system that uses microwave radar to measure the water level. Microwave sensors don’t need a stilling well- they can be mounted to a structure that sits above the water. This is a massive advantage, because servicing the sensor is much easier if you don’t need to don a wetsuit and air tank. In the coming years, NOAA is planning to transition it’s acoustic measurement stations to this new microwave technology.
So, if you can measure sea level without ever touching the water, from how far away can you measure, exactly?
Send In The Satellites
As it turns out, you can take measurements from pretty far away — about 830 miles away, to be exact.
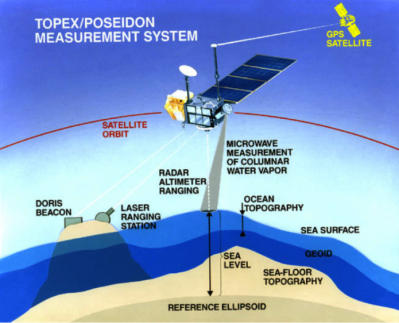
In 1992, an Ariane 4 rocket hurtled up from the Guiana Space Center to deliver the TOPEX/Poseidon satellite into orbit. The satellite carried an impressive array of instruments including two radar altimeters, a microwave radiometer, GPS receivers, and a laser retro-reflector array. The GPS system was able to pinpoint the satellite’s location to within an inch, and was the first system to demonstrate that GPS satellites could be used to locate another spacecraft rather than only terrestrial targets.
The TOPEX/Poseidon system was groundbreaking for a number of reasons. Not only was it able to measure sea level to an incredible degree of accuracy (1.5 inches), but it was the first mission to map the Earth’s tides. It mapped currents across the ocean, and gathered valuable data that improved our understanding of climate change, weather, and even the Earth’s gravitational field.
Although the satellite was shut down in 2006 after malfunctioning, its mission was taken over by Jason-1, which was launched in 2001 to supplement TOPEX/Poseidon’s measurements. Jason-2 followed, and in 2016 the mantle was taken up by Jason-3.
We know that these satellites do a great job of measuring the sea level, but what exactly are they measuring it against?
So Is Sea Level Zero?
 Well yes… and no. It depends on your reference point. If you look on any topographical map, you’ll notice that elevations are reported in height above (or occasionally, below) sea level. Pilots often report altitudes in AMSL, or Above Mean Sea Level. Mean sea level is obtained by time-averaging the still water level (SWL) to remove cyclical effect of daily tides. SWL is simply what can be measured with a tide gauge, the water level with sea motions such as wind waves smoothed out. This works well enough for measuring the elevation of things that aren’t, well, the ocean, but we run into a problem if we try to measure the ocean in terms of itself. This is where we need other references to measure against.
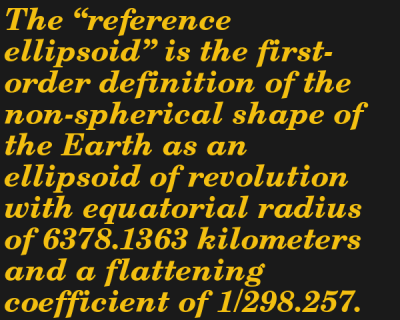
The satellite-based instruments report sea level with respect to the WGS-84 Reference Ellipsoid, defined by the TOPEX/Poseidon Data User’s Handbook as the “the first-order definition of the non-spherical shape of the Earth as an ellipsoid.” This is also the baseline GPS receivers use to convey elevation data. Another helpful reference surface is the geoid — the theoretical shape that the Earth’s ocean would make if it were free from the external influences of the Sun and other celestial bodies, only acted upon by the gravity and rotation of the Earth itself.
Does Mars Have a “Sea Level”?
This is all well and good for Earth with its vast oceans, but how is elevation measured on Mars (or other planets, for that matter) where there is no sea to reference?
If you want to measure a mountain on Mars, you better bring a barometer and a calculator. Zero elevation is defined as the isobar where the atmospheric pressure is equal to 610.5 Pa (for reference, “sea level” on earth has an atmospheric pressure of 101.5 kPa). Though seemingly selected at random, 610.5 Pa is the triple point of water on the red planet — that is, the pressure at which water can exist in its solid, liquid, and gaseous states simultaneously. From that, and a reference ellipsoid similar to the one we use for the Earth, the elevation of various geographic features is measured by laser altimeters affixed to an orbiting satellite such as the Mars Global Surveyor.
Let’s take a look at the Moon now, where the “atmospheric” pressure is effectively zero (okay, there’s some gas there but the pressure is around 
Back To The Beach
So, back to our initial quandary — what exactly is causing that receding shoreline you notice year after year? On average, the global sea level rises annually by about 0.14 inches, so while global warming is a very real concern you probably aren’t noticing its effects on the shoreline one year to the next. That leaves coastal erosion — the gradual removal of sand, rocks, and soil by the ocean. It’s a good thing then, if much of the coastline is so unstable, that we have tide houses and satellites to accurately track changes in the global sea level. That rock you tried to measure against is all but guaranteed to move.


Coastal erosion is in fact not the biggest influence on perceived sea level and waterline location; estuary silting and the sea washing material up onto the coast is increasing land area faster than sea level rise and erosion are removing it, resulting in the paradox that rising sea levels produce increased land area.
And human construction, of course.
Done right, done wrong in efforts to protect the coastline, it can actually increase scour further along. The benefits and evils of longshore drift apply.
There’s a couple of Roman ports in East Anglia now a couple of miles inland from silting up.
Another process occurring, particularly in areas which have acquired natural vegetation which accelerates it, is accumulation of new soil on the land. It can be raising the surface 1mm a year. It’s a combination of wind-borne loess from areas that are eroding (deserts, mountains, defective agricultural practices causing dust-bowls) a continual rain of meteoric dusts, and the effects of vegetation growing, dying and binding carbon as humus in the soil. Parts of Britain illustrate this well when you find Norman remains about a meter down, and roman remains about a meter below that. Fields that have been under the plow for years may be losing as much by wash off and wind while bare, that’s why they keep finding roman villas with plows in those. Human activity can contribute, scattering organic refuse, or wearing it away with foot traffic.
The effects of sea level rise will vary depending on where you are in the world. Yes silting is an issue yet not if you live on a low laying South Pacific island. We tend to concentrate on the impacts closest to us, slowly forgetting the wider picture. The are so many impacts that singling one out it’s not too helpful.
Could have done with a mention of..
https://en.wikipedia.org/wiki/Post-glacial_rebound
.. and lift due to tectonic forces of plates mashing together or tilting each other.
Do that right an you even get rid of parts of Jersey (US not UK)
The sea level was higher 2000 years ago. I remember on a recent holiday to Portugal we toured round a Roman villa with a port next to it. This was a few metres above current sea level and a few hundred metres inland.
Or the land was lower.
That area isn’t known much for tectonic activity, and is far far away from the ice covering of the last ice age.
If u say so
https://www.air-worldwide.com/publications/air-currents/from-1755-to-today-reassessing-lisbons-earthquake-risk/#:~:text=Several%20onshore%20faults%20in%20southwestern,Lower%20Tagus%20Valley%20(LTV).&text=Thus%20the%20return%20period%20of,highest%20risk%20area%20in%20Portugal.
Well, I guess that settles it.
Note that the picture shows correctly shows the water elevation follows the sea floor topography. How about a follow up on how good this system is at mapping the sea floor elevation by measuring the ocean surface? A main reason for the system?
Standard pressure is 101.325 kPa, not 101.5.
@Ralph Crammedin said: “Standard pressure is 101.325 kPa, not 101.5.”
Standard Temperature and Pressure (STP) can vary depending on what you are doing and who you are doing it for. See [1] for a bunch of variations. For example IUPAC uses 0 deg. C and 100.000 kPa while NIST uses 0 deg. C and 101.325 kPa. Nobody seems to use 100.500 kPa, maybe that’s a typo.
* References:
1. Standard conditions for temperature and pressure – Current use
https://en.wikipedia.org/wiki/Standard_conditions_for_temperature_and_pressure#Current_use
It is suspected that there is more water trapped in the Earth’s crust, due to subduction, than there is in all of the oceans. If you didn’t know that, or appreciate its implications, how much do you really know about global ocean volume dynamics? I know just enough to know how little I know and understand about how the entire system is evolving over time, and why.
I was maintenance manager at a beach front resort that was built in the 50’s (had those GREAT Federal Pacific breaker boxes too) They had pics from when it was brand new and the dunes went out about 150 m past the sea wall. You could see how the dunes got washed away over the years in the pics.
After we had a couple offshore hurricanes in 98-99 the sea wall got undermined a bit and then in 2000 it did it again and undermined the corner of the building!
Of course 20,000 years ago Florida was just a line of islands and thats why there are so many Endemic plants and animals on the Lake Wales Ridge.
Most of the erosion of beaches is not from waves, but from people walking on the beach. Sand sticks to your feet, body, towels, etc. and is then carried away. Much the same as a muddy spot on a dirt road gets bigger, because mud is splashed onto your car.
… and those idiots who are all “It’s free
real estatesand!” and bag up half a yard to fill their kids sandpit or whatever.Sorry but that is just a pure *bs*…
Most of the coastal erosion is from sediment movement. Quite a bit is caused by human developments like breakwaters as it creates micro currents at higher speed than “natural” (water flows like air – so imagine building a structure resembling a aeroplane wing – then apply usual lift/push relations as wings) – but despite of that most is actually natural. So some areas are more affected by sediment movement than others which causes what people think is water level changes. But if you had measured from a stable rock formation 5 miles from the coast – the picture would be different.
But we do not have any evidence that water levels are rising due to human created climate change. For a long time we heard but “Global ACCELERATED sea water level increases” – but the accelerated water level increases have been debunked. We have an average global water increase of about 3.3mm per year (0.013 inch per year) – that trend has been proven since about 1830 where we got the first measurement stations doing reliable measurements. The last 3-4 years have been about 0 increase in water levels.
The data from both satellites and normal measurements almost agree.
I have lived and worked in the marine environment all around EU/Middle East/Asia – incl. Maldives – and there is no significant change in average or mean high/low water levels going back to the first buildings built in the water.
3.3mm != 0.013 inch
haha sorry – 0.129921 inch (sorry I’m not an inch person)
Not true:
“The rate of sea level rise is accelerating: it has more than doubled from 0.06 inches (1.4 millimeters) per year throughout most of the twentieth century to 0.14 inches (3.6 millimeters) per year from 2006–2015. ”
https://www.climate.gov/news-features/understanding-climate/climate-change-global-sea-level
yes true.
Sorry – but even the latest IPCC agrees with no ACCELERATION in Sea Level change. A decade is not enough to show any kind of trend – the last 2-3 years have shown NO increases in average sea level.
But that does not mean that I say our sea level is not increases on average. It has done since the last ice age. A decade is not even worth considering.
But it is easy to sit with data from satellites and have fun. :) – You should – like I have – visit actual locations where buildings / harbours sit in the water all year around. They are magic for determining how sea levels change. The wear lines on the buildings from sediment floating past is clear evidence on how things change. And the short answer is – they change very little. In one plane it can be a couple of cm up – and 200 km away – it is a couple of cm down.
Even with 3.6 mm per year (vs avg of 3.3mm/year since 1993) – it will take almost 100 years to increase sea levels with 1′ (30.48 cm) – more than enough time to “fix” the issues – maybe like the Netherlands do.
In the 2009 the Maldives government was so panicked about sea level rise they had underwater scuba “government meeting” to shine light on the issue. But now you don’t hear much about the Maldives and Sea Level change – and they built their 5 new airports so close to the max sea water level that one would think they are “not smart” The spent 800ml US$ on expanding Male to be able to take A380’s (which are now being phased out….)
So Sea Level rise is NOT a huge issue – at least now and going a few thousand years back in time. But we should of course keep an eye on it but no need to panic or spend fortunes on “mitigation” that is not needed.
Let’s spend smart for once…
It’s conceivable that the government of Maldives don’t care what happens to an airport 80 years from now. If said airport is only a half meter above the current max level, they could mitigate problems 50 or 100 years from now with dikes and pumps. And even so, that’s only required under the more dire scenarios for sea level rise.
I read a different article that indicates that the sea level rate is variable but generally rising. https://www.forbes.com/sites/uhenergy/2018/06/15/is-the-ipcc-wrong-about-sea-level-rise/?sh=31f798f43ba0
Most likely changes in the ocean will affect different places in different ways. Some will see almost no change. Others will see more frequent inundation of sea water onto land and into fresh water sources during severe storms. And others still may see enough of a rise to lose significant land permanently. Because I suspect there will be a wide variation of results, there will necessarily be very different responses considered appropriate for each locale.
Feet, body, towels, and a lot in the ears. All those who don´t want to hear about climate change particularly.
Current sea-level change rates could increase sea-level by a foot in the next 100 years. Will coastal people where there are tides and there are storm surges more than an order of magnitude greater, notice the difference? Will it be changing to quickly to handle?
What if the bottom of the ocean rises, due to tectonic movement? Then, the sea level will rise as the water has to go somewhere. How is this taken into account? Is it even?
If the bottom rises a few centimeters, the top level will rise too, in a smaller amount though but we are talking centimeters in decades.
If you don’t take the bottom-level into the equation, measuring only the surface is useless. And I believe this is exactly what is happening.
It can rise in one place, but then it has to drop in another. The volume of the Earth is staying the same.
True but what if the drop is on dry land?
https://rwu.pressbooks.pub/webboceanography/chapter/1-4-mapping-the-seafloor/
I’m pretty sure the guys at NASA and NOAA are actual rocket scientists doing radar altimetry with SEASAT, GEOSAT, and Jason satellites.
I’m still waiting for that sea level rise apocalypse. I’ve been visiting Padre Island off the Texas Gulf Coast since I was a child. The beach is still there and same size depending upon season.
And where all those millions of ‘climate refugees’ from that alleged sea level rise? Only a dope would believe it.
The climate refugees are in places like Bangladesh. You wouldn’t notice them in Texas.
The so called “climate refugees” in Bangladesh are not from rising sea levels… It is because Bangladesh like the Netherlands are at or below the floodplain.
So low lands + big rivers that often overflow (and have done for 100’s of years) + massive rainfall (normal) – causes Bangladesh to become flooded almost every year without fail. And when they are unlucky and rain and river overflow coincides with high sea water levels – the area floods by gigantic proportions.
It would not be so bad if Bangladesh had the population under control. But the Bangladesh population has grown massively since 1971 when they gained their independence from Pakistan.
There are now about 165-170 million people in Bangladesh vs about 65 million in 1971. That is more than double in 50 years. They are bundled together on 150.000 km2 of land. For Americans – that is about the size of Georgia – so equal to about 1/2 of the US population all living in Georgia.
When the area’s flood – a lot of people have to “migrate” to dry land.
But it has nothing to do with climate change – it is and has been a regular occurrence in that part of the world even long before Bangladesh was independent.
It has become worse “impact wise” due to the amount of people affected – which is due to the 2.4% annual growth of people in Bangladesh. So the HUMAN cost have increased. But the core cause have not changed.
First, I would like to complement Adam on his excellent article. Below I will discuss the reference height for the altimetry measurements and other measurements that help us understand how sea level is changing and to further try to understand the issue of a reference height for these measurements.
The TOPEX series of altimetry satellites, JASON I, II and II, do measure sea level relative to a reference frame and to first approximation this reference ellipsoid is close to the geoid, as describe in the article. The JASON satellites are tracked using a laser retroreflector array (LRA) the doppler shift of signals from ground stations (DORIS) and GPS measurements, https://sealevel.jpl.nasa.gov/missions/topex-poseidon/spacecraft-and-instruments, so that we actually know their position of the satellite quite accurately relative to the center of the earth and thus can report the altimetry measurements relative to the reference ellipsoid with high accuracy. The above website also discusses a radiometer that is necessary to correct the radar altimetry measurements for atmospheric moisture, clouds and winds. All these measurements and sophisticated post-processing provide the amazing accuracy of the sea level measurements.
The geoid is essentially the surface perpendicular to the local gravity field and we know from Newton’s laws that this depends on the distribution of mass of the earth. The geoid varies considerably from the reference ellipsoid, for example in the Indian ocean by more than 100 m. Because of the Coriolis force, sea surface will vary from the geoid due to ocean currents. For the Gulf Stream, this deviation is more than 1 m. The distribution of mass is changing, for example due to the melting of ice sheets, so the geoid is also changing. In addition, the earth’s crust is elastic and will change as the load above it, for example the ice sheets, changes. In Svalbard, Norway, one sees the past coastline several meters above sea level due to “glacial rebound.” This leads to some non-intuitive results, where the “sea level” near Greenland will actually appear to go down when the ice sheets melt because the crust will rise, but sea level will rise elsewhere due to the melt.
Fortunately, we have the GRACE (Gravity Recovery and Climate Experiment) satellites, launched 2002, and the GRACE-FO satellites that are operating today. The GRACE mission is actually two satellites that measure their separation very accurately. The distance between the two satellites will vary as the satellites accelerate and decelerate due to the local gravity field. Thus, the Grace mission provides a measurement of the local gravity field and allow us to construct the time varying geoid and the changing distribution of mass of the earth. Here is the NASA website for GRACE: https://www.nasa.gov/mission_pages/Grace/index.html.
To make use of these measurements, we need to understand how sea level change occurs so that we can construct good models of the physics to predict future sea level changes. One can think of sea level as the height of a liquid in a glass becker. The level of the liquid can change in three ways; (1) fluid can be poured into the backer, (2) we can distort the becker or (3) the temperature of the fluid can change. The TOPEX measurements give us the height of the fluid. The GRACE missions address (1) and we can construct geophysical models of the earth’s crust to predict (2). The Argo Project, https://argo.ucsd.edu, provides the data for (3). Argo is an international program with approximately 4000 autonomous floats distributed throughout the global ocean that samples temperature and salinity from the surface to 2000 m depth, on a 10 day schedule matching the repeat rate of the TOPEX measurements. This array has provided global coverage for over two decades. Much of the change in temperature in the oceans occurs in this depth range, so we can estimate the effects of (1). We are presently developing floats that can profile over the full depth of the ocean and are developing a plan to deploy these floats globally. In summary, the TOPEX, GRACE and ARGO data provide the data that documents sea level rise and provides the data necessary to validate climate models so that we can predict sea level rise into the future.
These measurements and the analyses of them have been the basis for the UN IPCC reports.