The ionosphere is of great importance to shortwave radio transmissions, since it allows radio waves to be refracted and reflected over the horizon, and it’s therefore unfortunate that the height and thickness of the ionosphere depends on the time of day or night, weather, season, and the solar cycle. To get a better idea of current transmission conditions, [mircemk] built this shortwave propagation monitor.
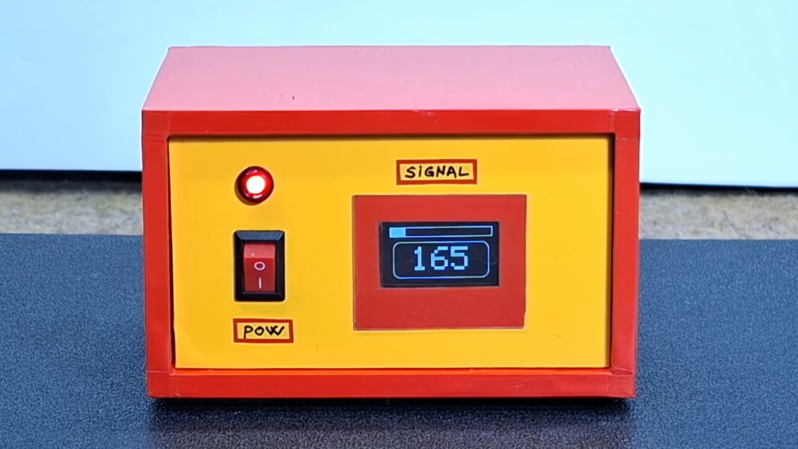
The monitor provides a basic measure of ionosphere conditions by measuring the strength of received shortwave signals: if the conditions for transmission are good, it should receive a relatively high level of existing signals, and a weak signal if conditions are bad. It has an external antenna connected to a signal strength indicator circuit based on the CA3089, which amplifies signals in the 1-40 MHz range and outputs a smoothed voltage indicating the RF energy in this range. The output signal can be read by any voltmeter, in this case an Arduino Nano with an OLED display. Assuming the same antenna is always used, the signal should noticeably fluctuate between night and day as the solar wind affects the ionosphere.
Of course, the distance at which you’ll be receiving a signal means nothing unless you have a receiver, which can range from the antique to the modern.


Original Elektor circuit 07/2004.
But this circuit is incorrect in that the CA3089 tuning meter output is used AC-coupled yet somehow becomes DC for the Arduino’s ADC/multimeter? That would need to be fixed.
Next gen IC was CA3189 (1978).
In my neighborhood that would be a grow-op-LED and ethernet-over-powerline detector.
If it can have that fancy display instead of a simple meter it should display some kind of spectrum.
The bands have different hot times.
If it could measure the spectrum, then it should listen for specific beacons from specific locations at specific frequencies. Then it could get a decent measure of the Maximum Usable Frequency, plus actual propagation. That would be immensely more useful than just measuring the local broadband HF noise level.
Given an input of scheduled program content, perhaps using the spoken language to narrow it down, I wonder how good an AI would be at identifying the tower transmitting a certain radio station or at least the rough geographic area, then providing a distance from the receiver.
It could be interesting to have a spider graph projected on the inside of a globe lamp as the display. Showing real time coverage area.
A raspberry Pi, real display and pskreporter 😀
Why not just use the RBN (Reverse Beacon Network) or the various other monitoring systems (PSK Reporter, …) to get an idea of propagation conditions?
That basically reminded me of human connectivity .off the start line,direct, block redirect give a boost correct all working together to achieve a goal. The finish line and trophy
This doesn’t seem to discriminate enough against local signals to be useful in most locations. Lots of interference sources everywhere. The suggestions to use the reverse beacon network are correct, those are real propagation beacons worldwide, and if you demodulate them, you can tell they are a real signal.