The ionosphere is of great importance to shortwave radio transmissions, since it allows radio waves to be refracted and reflected over the horizon, and it’s therefore unfortunate that the height and thickness of the ionosphere depends on the time of day or night, weather, season, and the solar cycle. To get a better idea of current transmission conditions, [mircemk] built this shortwave propagation monitor.
The monitor provides a basic measure of ionosphere conditions by measuring the strength of received shortwave signals: if the conditions for transmission are good, it should receive a relatively high level of existing signals, and a weak signal if conditions are bad. It has an external antenna connected to a signal strength indicator circuit based on the CA3089, which amplifies signals in the 1-40 MHz range and outputs a smoothed voltage indicating the RF energy in this range. The output signal can be read by any voltmeter, in this case an Arduino Nano with an OLED display. Assuming the same antenna is always used, the signal should noticeably fluctuate between night and day as the solar wind affects the ionosphere.
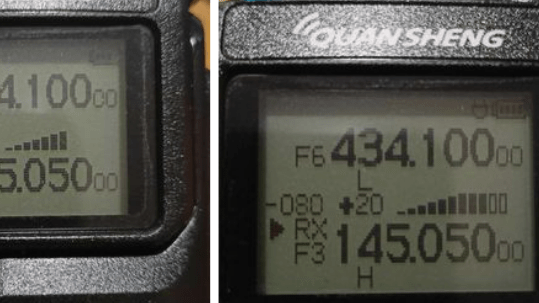
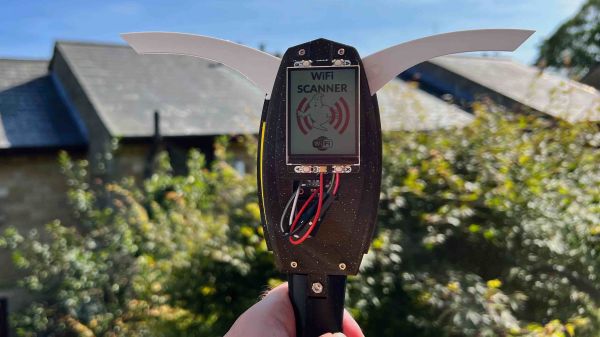
Of course, the distance at which you’ll be receiving a signal means nothing unless you have a receiver, which can range from the antique to the modern.

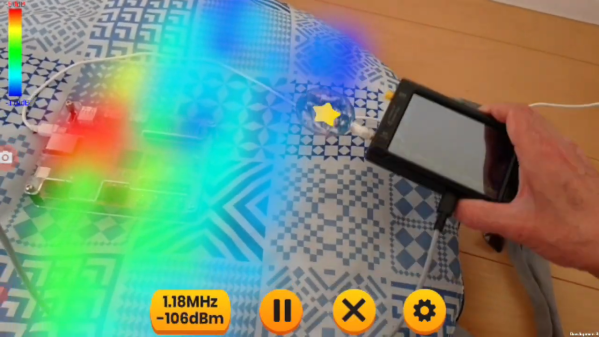
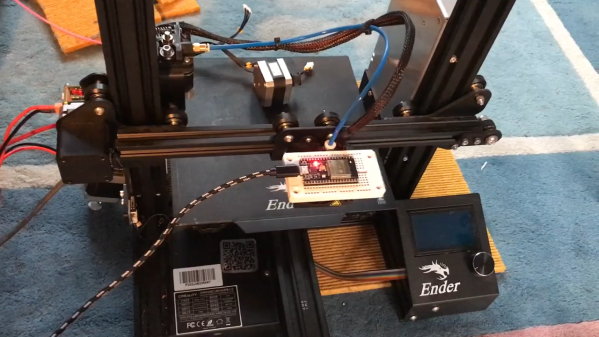
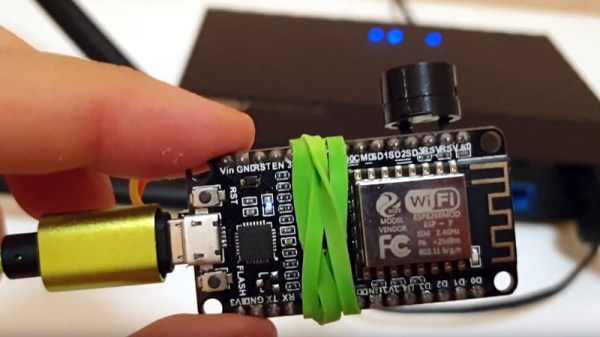
 Granted, based as it is on the gantry of an old 3D printer, [Neumi]’s WiFi scanner has a somewhat limited work envelope. A NodeMCU ESP32 module rides where the printer’s extruder normally resides, and scans through a series of points one centimeter apart. A received signal strength indicator (RSSI) reading is taken from the NodeMCU’s WiFi at each point, and the position and RSSI data for each point are saved to a CSV file. A couple of Python programs then digest the raw data to produce both 2D and 3D scans. The 3D scans are the most revealing — you can actually see a 12.5-cm spacing of signal strength, which corresponds to the wavelength of 2.4-GHz WiFi. The video below shows the data capture process and some of the visualizations.