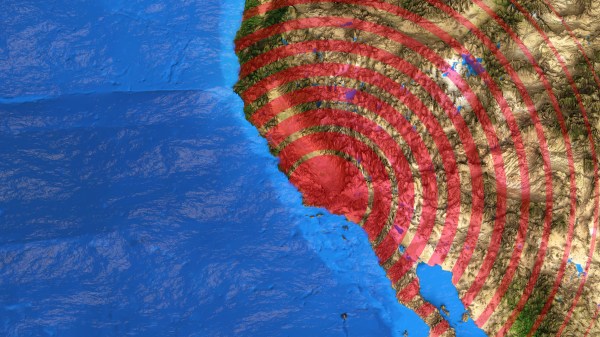
If your only exposure to seismologists at work is through film and television, you can be forgiven for thinking they still lay out rolls of paper to examine lines of ink under a magnifying glass. The reality is far more interesting in a field that has eagerly adopted all available technology. A dramatic demonstration of modern earthquake data gathering, processing, and visualization was Tweeted by @IRIS_EPO following a central California quake on July 4th, 2019. In this video can see the quake’s energy propagate across the continental United States in multiple waves of varying speed and intensity. The video is embedded below, but click through to the Twitter thread too as it has a lot more explanation.
The acronym IRIS EPO expands out to Incorporated Research Institutions for Seismology, Education and Public Outreach. We agree with their publicity mission; more people need to know how cool modern seismology is. By combining information from thousands of seismometers, we could see forces that we could not see from any individual location. IRIS makes seismic data available to researchers (or curious data science hackers) in a vast historical database or a real time data stream. Data compilations are presented in several different forms, this particular video is a GMV or Ground Motion Visualization. Significant events like the 4th of July earthquake get their own GMV page where we can see additional details, like the fact this visualization compiled data from 2,132 stations.
If this stirred up interest in seismology, you can join in the fun of networked seismic data. A simple seismograph can be built from quite humble components, but of course there are specially designed chips for the task as well.
Continue reading “Watch Earthquake Roll Across A Continent In Seismograph Visualization Video”