Sometimes when a project is coming together, you need to cobble a tool together to get it completed. Whether it’s something very involved, like building a 3D printer to fabricate custom parts, or something relatively simple, like wiring a lightbulb and a battery together to create a simple continuity checker, we’ve all had to come up with something on the fly. Despite having access to an oscilloscope, [Brian] aka [schoolie] has come up with his own method for measuring PWM period and duty cycle without a scope, just in case there’s ever a PWM emergency!
The system he has come up with is so simple it’s borderline genius. The PWM signal in question is fed through a piezo speaker in parallel with a resistor. The output from the speaker is then sent to an FFT (fast fourier transform) app for Android devices, which produces a picture of a waveform. [schoolie] then opens the picture in MS Paint and uses the coordinates of the cursor and a little arithmetic to compute the period and the duty cycle.
For not using a scope, this method is pretty accurate, and only uses two discrete circuit components (the resistor and the speaker). If you’re ever in a pinch with PWM, this is sure to help, and be a whole lot cheaper than finding an oscilloscope!


You could also determine duty cycle with a resistor, capacitor, and multimeter. Period/frequency would be a little trickier.
If the PWM fundamental frequency is faster than ~kHz, a multimeter by itself is fine. The RC is just a low-pass filter, and most multimeter’s DC inputs only have a frequency response of ~100-ish Hz anyway.
It’s easy to imagine that if a person did this a lot, they could get a grip on the PWM waveform by ear alone.
Sort of – ears aren’t polarity sensitive, so it’s not possible to distinguish between, for example, 10% and 90% duty cycle. As you go from min to max duty cycle, it starts off tinny, then goes to something richer, then back to tinny again.
Coolio – for us, we were confirming a PWM type application on a PLC device without a scope and did the whole “listening” thing to generate known musical notes.
We then converted it to play tinny Christmas music to bring the holiday spirit into the lab.
Your solution is lovely considering the ubiquitous nature of portable devices.
This article is the hallmark of Arduino thinking. Man blocks DC component with piezo. You could do the same thing with a CAPACITOR AND know what freaking parameters governing your frequency response, so you can say, I don’t know, apply some actual theory to your results.
And your theory will work fine until you look deeper and realize that extremely fast rise and fall times wreak havoc on the A-D converter’s ability to follow the signal, causing seemingly random jumps in your sample data. It’s not noise people, it’s just a lack of knowledge.
Not Arduino-ish at all. This is a matter of making use of things you already have at hand. You know, “hacking”.
Get used to it – you’re going to see more and more projects that use Androids as input and/or output devices.
If it wasn’t for your mention of “piezo” I would be sure that your comment was in response to some other article. I have absolutely no clue what you meant to say.
“Man blocks DC component with piezo.” – he wasn’t blocking the DC, he was using the piezo to make a click sound the phone could pick up…capacitors don’t make noise until they blow up.
Also, I’m not sure vibrating airwaves have rise or fall times…so not sure what that was about.
I believe the implication was that, with a cap blocking the DC component of the PWM signal, one could feed the signal directly into the audio mic jack of the device (phone/pc/whatever). The big failure of this is the assumption that the PWM signal has a AC RMS that won’t blow up the audio/mic input of the measuring device.
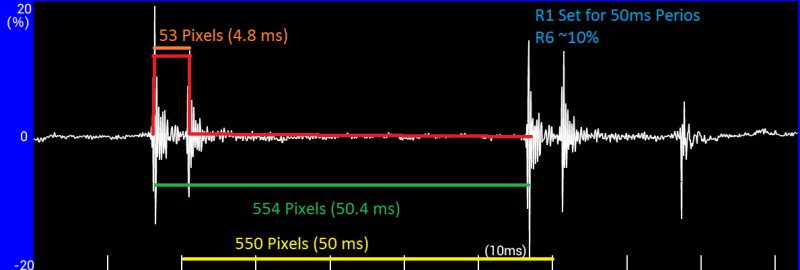
The second part (about theory) assumes that the PWM is above 20kHz (or 22kHZ, or what ever Nyquist applies). Looking at the signal plotted above, it seems the author already accounted for that and NotArduino didn’t apply their own theory to the information at hand. See, the visible picture shows a signal peak separation at 4.8 (call it 5) ms which is intended to be 10%. And it measures at approximately 10% of the signal width. All good, unless the PWM is oscillating faster than the Nyquist limit of the sampling device. Well, if 5ms is 10%, then 0.5ms should be 1% and close to the limit of the PWM. It nicely happens that a wave with a wavelength of 0.5ms happens to be exactly 2kHz. That’s just below C7, well in the range of human hearing and way below the 4kHz that telephony cuts at; way below the Nyquist limit of the 44k sampling rate of most modern devices.
In fact, you’d need a PWM frequency of 20kHz to be worried about the cheaper 40kHz ADCs in some phones. As long as the PWM f is below that, measuring this way makes sense and works.
you could also build a droid-scope, there’s apps and instructables for them already. This is a quick lo-fi fix and it works, so kudos for finding another way using whatever is to hand :-)
I like using the piezo to convert to acoustic. But using FFT is like walking around the block to get to where you already are. There are oscilloscope apps for Android that will display the acoustic waveform in time domain, with a scale calibrated in milliseconds. Way more straightforward.
that was unclear to me too but i think it’s a miscommunication – the app he’s using is designed to do FFTs, and it’s called “SimpleFFT”, but he’s not using the FFT function. it has a time-domain view, and that’s what he’s actually using to do his measurements.
Corrected, I stand.
Not related to the article, and not to sound so negative, but does anyone else really not like this new site layout? HAVING THE HEADLINES IN ALL CAPS TAKES UP TOO MUCH SPACE AND DETRACTS FROM THE ARTICLES.
I can’t quite put my finger on what else is going on, but my eyes just seem to prefer the old layout. I’m sure they’ll continue to improve it, but am I alone here?
You’re not alone.
I with you. I feel as if I should wear shades while reading the new layout. I feel like I am being shouted at.
YOU ARE NOT ALONE.
WHAT?
The old layout was like an early 2000’s amateur blog.
The new layout is like a gimmicky web2.0 ‘zine.
*Crosses fingers in the hopes that they’ll seek a middle way*
> The old layout was like an early 2000’s amateur blog.
That’s because it was. I’m going to take offense to the gimmicky web2.0 zine. We don’t have portraits of people that are inexplicably in circles, there’s literally no javascript parallax on the page, and you’re not going to break your scroll wheel on hackaday. Also, there’s actual content.
Brian: except for the lack of comment functionality (which I presume is being worked on), I must be one of the few who doesn’t mind the layout. That said, there is at least one circle face in your design: my profile pic ;-)
Yeah, I’m not a fan of the uppercase either. I saw a headline the other day about CPUS. What is a CPUS? (I know what CPUs are, but pluralized acronyms and initialisms don’t read well in caps.)
Also this from 2012: Android Oscilliscope Built From Parts Just Laying Around
http://hackaday.com/2012/07/14/android-oscilloscope-built-from-parts-just-laying-around/
So he’s transferring the =image= of the =graph= from his phone to his PC, then doing math on the pixels? More power to him for using tools he already has, and the acoustic approach does have some potential safety / isolation benefits, but yeah, that seems like a few too many steps.
Since his PC is already nearby, it might be easier to connect the signal to his sound card (through a voltage divider, perhaps), and use audio apps to visualize and/or measure directly, skipping the capture-to-phone and transfer-image-to-PC steps. Personally, I use this kind of setup, plus Audacity, as a kind of digital storage ‘scope. This lets me see detail down to the sample (by zooming waaaay in), or run an FFT to see the spectrum. The limits of such a setup lend themselves more to AF than to RF, but most of my work is at AF anyway.
Takes me back to 1966, as an IBM field engineer servicing 024 card punches that used to be controlled by a punched card wrapped around a rotating drum – tiny rotating five pronged star wheels would dip into the punched holes, allowing pre-tensioned wires to contact adjustable brass studs. To get the make/break duty cycle right, I would use a multimeter and measure the resistance across the contacts while the drum was in motion – A certain ohms value indicated a 50/50 duty cycle.