The higher-power ARM micros have a bunch of debugging tools for program and data tracing, as you would expect. This feature – CoreSight Trace Macrocells – is also found in the lowly ARM Cortex M3 microcontroller. The Cortex M3 is finding its way into a lot of projects, and [Petteri] wondered why these debugging tools weren’t seen often enough. Was it a question of a lack of tools, or a lack of documentation? It doesn’t really matter now, as he figured out how to do it with a cheap logic analyzer and some decoders for the trace signals.
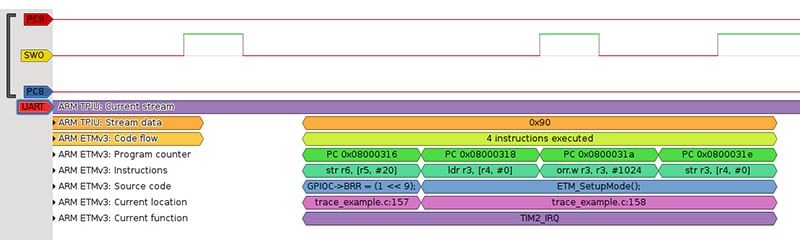
There are two trace blocks in most of the Cortex M3 chips: the ITM and ETM. The Instrumentation Trace Macrocell is the higher level of the two, tracing watchpoints, and interrupts. The Embedded Trace Macrocell shows every single instruction executed in the CPU. Both of these can be read with a cheap FX2-based logic analyzer that can be found through the usual outlets for about $10. The problem then becomes software, for which [Petteri] wrote a few decoders.
To demonstrate the debugging capability, [Petteri] tracked down a bug in his CNC controller of choice, the Smoothieboard. Every once in a great while, the machine would miss a step. With the help of the trace tool and by underclocking the micro, [Petteri] found the bug in the form of a rounding error of the extruder. Now that he knows what the bug is, he can figure out a way to fix it. He hasn’t figured that out yet. Still, knowing what to fix is invaluable and something that couldn’t be found with the normal set of tools.


I highly recommend to try out the demo version of Keil’s MKD. It has a code/data size limit of 32kB for compile and debugging. That should get your project at least to enough sanity to get past the tricky hardware driver/low level stuff. Besides easy to use, it does a lot more than you think you need and let you do your work. You’ll wonder why you didn’t use it.
You can switch the compiler to GCC and that’ll remove the compile limit and probably need to use OpenOCD for the debugger. See here for the IDE switches to use GCC as compiler to compile RVCT code and the RVCT switches to compile GCC extension.
https://hackaday.io/project/1347-fpga-computereval-board/log/9404-compile-k22dx5-under-chibios-30gcc-in-rvct
See code profile and peripheral level register GUI (UART in picture) with full annotation. Very useful stuff.
https://hackaday.io/project/1347-fpga-computereval-board/log/7511-chibiosrt-hal-drivers
Serial debugging is so 1980’s…
I agree with this commenter. When I was learning how to properly set up the peripherals Keil MDK was a life savor. These chips are not your two or three register setups for a PWM to work, nearly every time pin muxing comes into play. Unfortunately Keils MDK is prohibitively expensive and guaranteed outside a hobby budget.
I keep it installed and do my general setup with it then load up Rowley CrossWorks for ARM and just copy over the initialization routines. I much prefer CrossWords as its only $100 for a personal licence and its pretty bulletproof. Even a built in RTOS.
I tried GCC and Eclipse but I would spend more time in compiler setup and plugin issues than I ever did coding and actually started avoiding projects because of it… very bad.
Context: It was my first ever ARM hardware/firmware project trying to port a pre-release bleeding edge RTOS version I have not used before to a new device sub family on a new tool chain on the first version of hand soldered proto PCB without the experience of porting a someone else’s code on a contest with a real deadline. What can possibly go wrong? :) (dev board was not out yet!) BTW I did make it past that first 3 weeks under my own efforts.
When you are porting code that you don’t understand on hardware you don’t know yet (or proven) that random locks up in non recoverable exception, last thing you want is to fight with the tool and someone on a forum rudely tell you to RTFM etc. On the ARM that can easily happen for silly thing like forgetting to enable the clock for a peripheral _both_ in clock tree and the peripheral!
I have literally sat on ARM projects when I found out the horror of manually set up GCC compiler scripts if your device happens not to be a chip that everyone has used already. The tool at least let me focus at the problem on hand and show me what each of the hardware register bit does in a nice GUI without the constant distraction of looking them up in the 1000+ page pdf file. Keil did messed up their exception vector for that chip. :(
Poor people use CooCox.
http://www.coocox.org/
That is an absolute beauty.
We mustn’t forget to mention that this project is built upon the sigrok free software suite for oscilloscopes, logic analyzers, multimeters and all kinds of lab tools. I would love to sigrok become better known by the hackaday crowd.
Any chance on bumping the DSlogic up the queue?
It is very nice to see time collation on the signal traces along with what the ARM core is doing. That’s very useful if you are debugging hardware drivers. Good job writing the decoder, [Petteri Aimonen]!
That’s pretty cool. Dedicated hardware for tracing, such as Segger’s J-Trace or Keil’s ULink Pro cost somewhere north of a thousand euro’s. The logic analyzer used here can be found for less than 10. I’m definitely going to check this one out!
There is this: http://keithhack.blogspot.ch/2013/10/cheap-arm-programmer.html
Flashing a cheap development board with CMSIS-DAP as a debugger that is supported by OpenOCD, Keil’s MKD tool etc. You can use it on any ARM chips that support SWD (and not just Freescale’s.)
The HID protocol is very inefficient, and not as fast as the Segger tools.
CMSIS-DAP is just a debugger with ITM support, the really expensive devices are the ones that support the lower level ETM like mentioned in the article. A fair chunk of the extra cost is related to correlating the debug data to the tracing data. Once someone gets those two parts together in a cheap device, then we can complain about the price of the J-TRACE (not to be confused with the J-Link) and the ULink Pro (not the same as the ULink-2).
Not sure how up to date in this page of ETM enabled chips: http://www.keil.com/ulinkpro/etmchips.asp
I see the STM32F103 part that is on those $4 clone dev board from China. :)
Haven’t used any of the expensive tools, so I can’t say I know the capability of those expensive tool. There are some level of ETM support with the CMSIS-DAP firmware & a supporting IDE (IAR in the thread) that can talk to it.
That’s just the onchip stuff and not correlated what’s happening outside the chip at the same with a logic analyzer as I comment earlier at March 9, 2015 at 3:44 pm.
https://community.freescale.com/docs/DOC-95397/version/2
>Testing Platform: IAR EWARM6.6 + FRDM KL25 (OpenSDA with CMSIS-DAP fimware)
:
>3) click the debug button to access thw debug window, then click the CMSIS-DAP->ETM Trace from the menu bar, and the ETM trace window will appear. Note that, the trace function is disabled in default, so another step is needed to click the “power port” at the top left corner to enable the trace function. The screenshot shows it below;
>4) Now, the MTB is working. We can try it by click “run” and wait a while to click “pause”, then the instructions from run to pause are shown in the trace window, it is really convenient. Besides, we can save, clear or zoom the trace results.
Some chips have ETB (embedded trace buffer), which is a block of RAM where it can store the trace instead of putting it out through IO pins. Then when you stop at a breakpoint, you can read it out and decode.
I think there has been some planned support for this in OpenOCD. Though STM32’s (my platform of choice) don’t have ETB, so not so useful for me.