Proper Routing Makes For Many Happy Return Paths

Here’s a question for you: when your PCB has a ground plane layer, where do return signals flow? It seems like a trick question, but as [Kristof Mulier] explains, there’s more to return path routing (alternate link in case you run into a paywall) than just doing a copper pour and calling it a day.

Like so many other things in life, the answer to the above question is “it depends,” and as [Kristof] ably demonstrates in this concise article, the return path for a signal largely depends on its frequency. He begins by explaining current loop areas and how they factor into the tendency for a circuit to both emit and be susceptible to electromagnetic noise. The bigger the loop area, the worse things can get from a noise perspective. At low frequencies, return signals will tend to take the shortest possible path, which can result in large current loop areas if you’re not careful. At higher frequencies, though, signals will tend to follow the path of minimal energy instead, which generally ends up being similar to the signal trace, even if it has a huge ground plane to flow through.

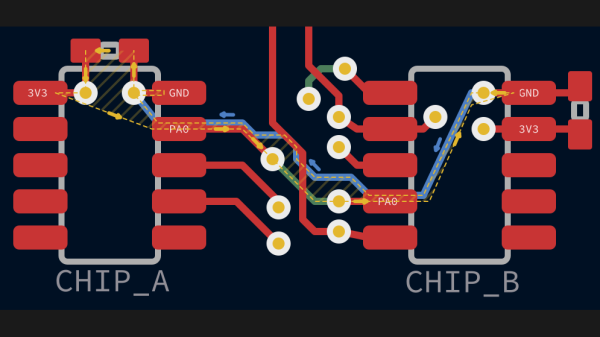
Since high-frequency signals naturally follow a path through the ground plane that minimizes the current loop, that means the problem takes care of itself, right? It would, except that we have a habit of putting all kinds of gaps in the way, from ground plane vias to isolation slots. [Kristof] argues that this can result in return paths that wiggle around these features, increasing the current loop area to the point where problems creep in. His solution? Route all your signal return paths. Even if you know that the return traces are going to get incorporated into a pour, the act of intentionally routing them will help minimize the current loop area. It’s brilliantly counterintuitive.

This is the first time we’ve seen the topic of high-frequency return paths tackled. This succinct demonstration shows exactly how return path obstructions can cause unexpected results.

Thanks to [Marius Heier] for the tip.

Finally! A Typeface For Hardware People

When it comes to novelty typefaces there is no shortage of weird and wonderful fonts to be found when you have finally tired of Comic Sans. Everything from bananas forming letters to Wild West saloon lettering can be yours, plus of course our favourite, the embossed Dymo label. But there’s a new kid on the novelty typeface block, and for us it sweeps all before it.

Scopin’ Sans is as its creator [Guy Dupont] calls it “A typeface for hardware people”, and its party trick is that it doesn’t produce letters. Instead it forms an oscilloscope trace that displays what it would look like as serial data. Instantly your text jumps straight to 1337, and you win the internet.

We have shamefacedly to admit that we don’t know binary ASCII by sight, so we’ll have to take his word for it. But for the curious there’s a demo from which you can amuse yourself creating traces, and if you can’t recognize serial ASCII then the chances are few of the people around you can either. We take our hats off to [Guy], and it’s something we’re sure we’ll use at some point to delight and confuse our friends. It’s not the first font we’ve brought you, here are some more if you come from the bitmap era.

Commodore 64 Monitor Traces I/O Calls, Eases Debugging

Developing for the Commodore 64 can be a rewarding retrocomputing experience, and thanks to [Dave Van Wagner], things are easier with his C64 IO_Monitor project, which opens the door to logging and tracing Kernal I/O calls for closer inspection. That’s not a typo, by the way. Kernal is what handles the C64’s low-level OS routines. Amusingly, as the story goes, it did in fact originate as a misspelling of kernel, but the name stuck.

What [Dave]’s program does is trace and log all input and output calls going through Kernal, which includes just about any function one might imagine. Things like keyboard input, screen output, and disk or tape I/O are all dutifully counted and logged, allowing one to really peek under the hood at a low level when doing any kind of development work. This kind of tool has turned out to be pretty handy given [Dave]’s penchant for porting Commodore emulators to a variety of (sometimes unusual) platforms.

Interested in giving it a spin? Head to the project’s GitHub repository for all the necessary files as well as some usage details, and enjoy making debugging and development a little less opaque than it otherwise would be.

PCB internal bodge

PCB Microsurgery Puts The Bodges Inside The Board

We all make mistakes, and there’s no shame in having to bodge a printed circuit board to fix a mistake. Most of us are content with cutting a trace or two with an Xacto or adding a bit of jumper wire to make the circuit work. Very few of us, however, will decide to literally do our bodges inside the PCB itself.

The story is that [Andrew Zonenberg] was asked to pitch in debugging some incredibly small PCBs for a prototype dev board that plugs directly into a USB jack. The six-layer boards are very dense, with a forest of blind vias. The Twitter thread details the debugging process, which ended up finding a blind via on layer two shorted to a power rail, and another via shorted to ground. It also has some beautiful shots of [Andrew]’s “mechanical tomography” method of visualizing layers by slowly grinding down the surface of the board.

[Andrew] has only tackled one of the bodges at the time of writing, but it has to be seen to be believed. It started with milling away the PCB to get access to the blind via using a ridiculously small end mill. The cavity [Andrew] milled ended up being only about 480 μm by 600 μm and only went partially through a 0.8-mm thick board, but it was enough to resolve the internal short and add an internal bodge to fix a trace that was damaged during milling. The cavity was then filled up with epoxy resin to stabilize the repair.

This kind of debugging and repair skill just boggles the mind. It reminds us a bit of these internal chip-soldering repairs, but taken to another level entirely. We can’t wait to see what the second repair looks like, and whether the prototype for this dev board can be salvaged.

Thanks to [esclear] for the heads up on this one.

Teaching A CNC New Tricks

Computer Numeric Control technology has been around for a long time. It’s at the heart of our 3D printers, laser cutters / etchers and CNC milling machines. They all work the same way — you begin with a CAD program and make some type of design. Then the computer converts the file into a set of XYZ coordinates and moves a tool head accordingly. Now let us pose to ourselves a most interesting question. What if you reversed the process? What if you could take a CNC’d object and convert it into XYZ coordinates?

This is precisely what [dave] is attempting to do. He’s made a basic CNC outfit and installed encoders on the steppers. He then manually moves the tool head to trace out an object. At the same time, the encoders are feeding the coordinates to a computer for recording. The idea is to replay the coordinates to see if the CNC can replicate the object.

Judging from the video below, the project is a success!

Continue reading “Teaching A CNC New Tricks”

Execution Tracing On Cortex-M3 Microcontrollers

The higher-power ARM micros have a bunch of debugging tools for program and data tracing, as you would expect. This feature – CoreSight Trace Macrocells – is also found in the lowly ARM Cortex M3 microcontroller. The Cortex M3 is finding its way into a lot of projects, and [Petteri] wondered why these debugging tools weren’t seen often enough. Was it a question of a lack of tools, or a lack of documentation? It doesn’t really matter now, as he figured out how to do it with a cheap logic analyzer and some decoders for the trace signals.

There are two trace blocks in most of the Cortex M3 chips: the ITM and ETM. The Instrumentation Trace Macrocell is the higher level of the two, tracing watchpoints, and interrupts. The Embedded Trace Macrocell shows every single instruction executed in the CPU.  Both of these can be read with a cheap FX2-based logic analyzer that can be found through the usual outlets for about $10. The problem then becomes software, for which [Petteri] wrote a few decoders.

To demonstrate the debugging capability, [Petteri] tracked down a bug in his CNC controller of choice, the Smoothieboard. Every once in a great while, the machine would miss a step. With the help of the trace tool and by underclocking the micro, [Petteri] found the bug in the form of a rounding error of the extruder. Now that he knows what the bug is, he can figure out a way to fix it. He hasn’t figured that out yet. Still, knowing what to fix is invaluable and something that couldn’t be found with the normal set of tools.

PCB Trace Antenna

If you’re working on a device that includes RF wireless, [Colin’s] Guide to PCB Trace Antenna Design might clear some headaches when sending off for PCBs. While it is directed at devices transmitting at 2.4GHz, the techniques and recommended equipment (read: espresso smith charts and network analyzers) should work for almost any frequency. While trace antennas aren’t as easy to implement as a measured wire, the space benefits make up for the difficulty. Unless you don’t mind how larger your project is, did someone say cantenna?