Given its appearance in one form or another in all but the cheapest audio gear produced in the last 70 years or so, you’d be forgiven for thinking that the ubiquitous VU meter is just one of those electronic add-ons that’s more a result of marketing than engineering. After all, the seemingly arbitrary scale and the vague “volume units” label makes it seem like something a manufacturer would slap on a device just to make it look good. And while that no doubt happens, it turns out that the concept of a VU meter and its execution has some serious engineering behind that belies the really simple question it seeks to answer: How loud is this audio signal?
Miles of Cable
Unsurprisingly, the modern VU meter can trace its roots back to the twin formative technologies of the 20th century: telephone and radio. For the first time in history, the human voice was projecting further than the distance the loudest person could shout, and doing so by means of electrical signals. Finding a way to quantify that signal and turn it into a value that represented the perceived volume of the original sound was crucial to design a system that could faithfully transmit it.
Given the nature of their network, the early telephone pioneers’ efforts at sound level metering were based on line losses over a “standard mile” of cable. Meters calibrated to this standard made it easy for them to adjust their vacuum tube repeaters to compensate for the speech power loss over a known length of wire.
As radio became commercialized and more widespread, the correlation between sound levels and loop length began to make less sense. In the 1920s, radio and telephone engineers began to converge on a better solution. The transmission unit (TU) was used to measure the power ratio between two different sound sources. It’s a logarithmic measure, and as such better reflects how the human ear perceives sounds. The TU measurement also had the advantage of being usable at any frequency since it doesn’t factor in the inductance and capacitance of a miles-long loop of wire.
Many TU meters were marketed over the 1920s and 1930s to sound engineers, whose ranks swelled when the film industry introduced “talkies.” There was no real standardization, however, and it was becoming increasingly hard to compare sound levels between industries, and often between different pieces of sound equipment. In the late 1930s broadcasters, motion picture companies, and the telephone industry all got together to hammer out a standard that could be used for all audio signal measurement needs. They dubbed the new measurement “Volume Units,” and the VU meter was born.
Follow the Bouncing Needle
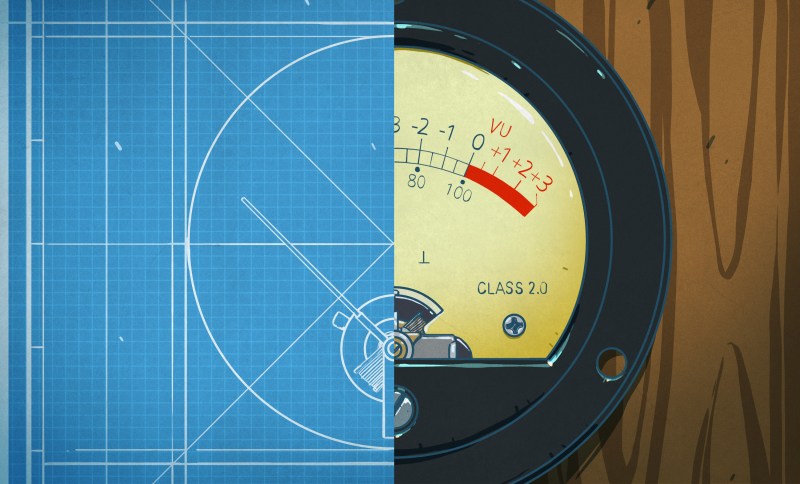
Given the technology of the time, the definition of what exactly constitutes a volume unit was based on the characteristics of the moving coil meter. The standard device was a microammeter with a 200 μA full-scale deflection. Because the incoming signal is actually an alternating current, the meter was specified to have an internal full-wave bridge rectifier. Zero on the meter scale was defined as where the needle points when a 1-mW pure sine wave audio signal at 1000 Hz is placed across a 600 Ω load. This point ends up about two-thirds of the way across the scale.
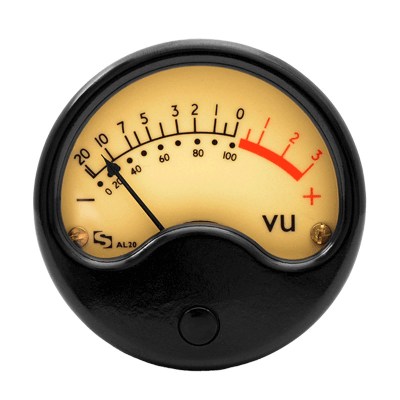
The scale to the left of the zero point is generally in black, with a value of -20 dB all the way at the bottom of the scale. Past the 0 dB point, the scale is usually shown as a solid red region that ranges up to 3 dB at the top. Some VU meters include a second scale in arbitrary units where the 0-dB point is shown as 100%.
The original spec for the VU meter recognized the fact that it takes a finite amount of time for the needle to deflect from rest to 0 dB. It limits the time to get to within 99% of 0 dB to 300 milliseconds and allows for a little overshoot — about 1%. The lag that an electromechanical meter introduces might seem like a bug, but it’s really a feature because it imitates the way the human ear perceives sound. Think about that 1000 Hz tone that’s used as a standard for the VU meter spec. If you have an audio oscillator set to 1 kHz and turn it on really loud, it won’t be too long before everyone within earshot tells you to turn it off. But if you take that same tone through the same amp at the same volume, but only play it for half a second, it won’t seem nearly as loud. The VU meter perfectly reflects that — the continuous tone will bring the needle to 0 dB quickly and leave it there, but a single pip of the same tone will barely move the needle.
Of course in the 80 years or so that VU meters have been around, the moving coil meter upon which it’s based has become somewhat passe. Alternate meters have come into use, from fully electronic LED bar graph displays to meters that just exist as software. These meters still need to mimic the lag of a physical meter to be useful as a VU meter, and perform so-so either through software or via circuitry that mimics the ballistic nature of a mechanical meter.
The VU meter is not the only game in town when it comes to measuring audio levels, of course. The peak-program meter (PPM) is common internationally and as the name suggests, measure the audio peaks rather than the average signal like a VU meter. Pro audio engineers and audiophiles debate the relative merits of the two metering methods with an intensity only pro audio engineers and audiophiles can understand, but it’s clear that both meters have their place.


Once again…
Nice artwork, Mr. Kim!
+1
What a wonderful and insightful article!
Aren’t the “arbitrary units” just a linear percentage of 1mW? e.g. -6dB aligns to 50% ?
They are more probably 100% amplitude modulation corresponding to maximum undistorted* modulation of a radio broadcast transmitter. You get a louder signal if you go above 100% but it is distorted. (Look up amplitude modulation for details).
Station operators would ‘gain ride’ the modulation signal to keep close to the maximum loudness with occasional peaks above if it didn’t sound too bad. Standardized Vumeters allowed an operator to set modulation signal to the correct level levels before it hit the airwaves.
*undistorted – a technical term which is ignored by everyone except, sometimes, the listener.
Another cool history article!. I personaly, as a 30 y.o did not know the history of those V.U’s .
As a 56 year old I did know as well. But stuff like this keep me visiting.
When using Audacity in it’s default mode the VU meters have a vague blended rainbow coloring, a most annoying effect. This seems to be stylists messing with the old very effective mode. It’s still there, you have to click it over to the meter with both a VU mode with peak with 5 sec hold and hold and RMS all in one strip. Undock it and stretch it across the full screen you will get a VU meter you see across the recording studio space.
The VU meter in VLC seems to be peak but then has that annoying rainbow fade and no ticks or labeling. Still under construction… oh is that why the orange safety cone is there.
In the digital domain it seems like it’s like a century ago again. Just adhere to the standard.
The problem is that, for digital equipment, peak is more important because of the razor sharp clipping at 0fs.
Peak is often 10 or even 20 dB hotter than RMS (VU)
Also, people expect to be able to go “a little bit” into the red without clipping.
Equipment will thus set an arbitrary “0 VU” level somewhere at 1, 2 or 3 bits below FS, or perhaps 10 or 20 dB below. There is no real standard for this.
You can model the specified VU meter behavior in software quite easily, but there are the twin problems that this won’t help with peak clipping, and there’s no accepted standard for what bit value constitutes nominal zero.
A peak meter with 0 at full scale is the most accurate, least ambiguous meter to use in these situations.
It wouldn’t make sense to make a modern level meter mimic the response of a VU meter, unless you were using this to set a level that is being used in circuitry that has soft limiting, such as vacuum tube amplifiers and magnetic recording.
I’ve heard several music tracks where the producer seems to have thought a “bit of red” was ok while using a peak meter in digital mastering. Super irritating.
A common missconceptuon. Hold over from much more forgiving analog equipment. People need to learn that digital audio has basically ZERO overhead. 0db is an absolute max. Exceeding it causes horrible splatter (distortion).
Not if you are working with 32-bit files in a 64-bit pipeline like the Reaper DAW. You will see the peak meters going over read, but if you route the signal to another track and bring it down, you will see that there is no clipping of the waveform. This is because 32-bit files (floating point IEEE) go up to +770 dBFS. Proper digital is also more forgiving, coming from a long career in audio engineering, and having worked with tape reels and up, I can say that with 24-bit files, we have more dynamic range, without the distortion added either we want it or not (sometimes we do).
I think it has more to do with the ‘loudness war’. Plenty of pages out there in internet land on this “phenonema”.
Or they liked the sound for some artistic reason, and only because we know what underlies the artifact do we find it particularly grating.
Search also about the True-Peak metering, which also reports the inter-sample clipping. I have seen 0 dB Peak fs (full-scale as they call the digital peak scale), been reported as +3 or even as far as +5.7 dB in True-Peak.
It also depends on how the peak meter’s algorithm work. Some bad software implementations (DAW, editors, etc.) doesn’t take under consideration the framerate of your computer monitor and they don’t support reporting the sample measurements that happened while your video card was updating frames. For example, if you have set your sound cards clock and software project session on 48000 Hz, then 48000 samples are passing through the meter, while your screen may update 60-120 frames per second. Luckily many modern audio applications respect that and report correctly.
I suspect many “vu meters” are just relative level meters. Certainly in consumer equipment, I’m not sure any real care has been done to have them conform to “vu” standards.
They do act as level meters, and often are useful to make sure levels aren’t too high or too low, but they aren’t exact.
Kind of like “s meters” on communication equipment, they will show relative strength of incoming signals, but even on high end revivers won’t show exact level.
Michael
You are right, for the most part. The idea behind VU meters was to be able to set signal levels so that they could be passed between different manufacturers’ equipment with consistent results, and that’s still one function of VU meters, but most of where we see VU meters is where we are trying to set a level as high as possible without hitting the limits of the equipment, which generally won’t be 1 mW. In the old days, this meant we were avoiding overdriving magnetic tape or broadcast modulators, Today, it’s more about not hitting the clipping level of an amplifier or the high end of an ADC. But in any case, unless there’s an output jack that the VU meter indicates the amplitude of, it is not really a dBm scale (i.e., dB referenced to 1 mW, which for audio equipment implies into a 600 ohm load) but a dBc scale, where ‘c’ stands for ‘carrier’ and indicates a modulation level, which is a device-dependent reference level.
This is not really like ‘s’ meters, which appear to be an arbitrary scale. They’re not, though – there actually are industry standards for what the values 0 through 9 indicate, but that’s a whole other discussion. The point is that whatever the reference level is, VU meters are always calibrated in dB relative to that reference level. Well, they used to be, when VU meters had pointers and scales on them. The values that each LED indicate are pretty arbitrary, these days. Sure, there may be numbers and tick marks, but these rarely make any sense. For example, there may be tick marks indicating -20, -10 dB, and 0 dB, but then there are three LEDs between -20 and -10, but maybe five between -10 and 0, so how are you supposed to interpret the intermediate LEDs? You’re not – the only calibrated value is 0.
But these go to 11 https://www.youtube.com/watch?v=KOO5S4vxi0o
Here we have yet another scale with the numbers backwards. Why can’t 0 be for silence?
because no one would agree on what value for “optimum”
Another backward scale? What scale, other than dB, reads in “backwards” numbers?
But to respond to your question, because to give an indication roughly comparable to perceived loudness, the scale has to be logarithmic. There is no natural 0 on a logarithmic scale, and the lowest indication depends on the noise level in the system, which varies from system to system. So if you were to declare that 0 is the background noise level, then the maximum level before clipping, or overmodulation, or ADC limit, would be different for each system, depending on the dynamic range of the system. The radio community ran into this issue, and their solution was the ‘S’ meter to indicate received signal strength, which reads from 0 to 9, with 9 being the reference level, which would address your concern about backward scales, but this turns out to be equally ambiguous, since the indicated numbers are not well adhered to, and are largely marketing-driven. Marketing people want to be able to say, “comparing two radios side-by-side with a weak signal, our radio receives this signal with an S value of 8, compared with brand X that only gets a 6”. There is no absolute level that ‘9’ represents.
The advantage of a ‘backward’ scale is that the level that is most important – the “never exceed” level, is always 0.
“There is no absolute level that ‘9’ represents.”
Actually, there is an industry standard: S meter reading of “9” equals to 50uV (microvolts) unmodulated carrier level (regardless of frequency) at the receiver’s 50 ohm antenna input. S9 is the meter’s reference level. Each S unit between 1 and 9 equals to -6 dB, compared to S9. Thus, S8 = -6dB from S9, S7 = -12 dB from S9 etc. Higher than 50uV (=S9) levels are indicated by “+10”, “+20”, “+30” etc. on the meter scale (usually right) from S9. Those numbers are dB above the S9 reference level. So, for example, S9+20 means that the signal level at receiver antenna input is 500uV (microvolts).
In general, this standard is adhered to in all professional,and amateur radio receivers regardless of frequency and the type of S meter (analog or digital).
“Cheapo” consumer AM and FM receivers most likely have any arbitrary scales and reference levels. There is no point in comparing those. And, of course, the S meter comparisons are only used by the sales people of those cheapo receivers. That kind of comparisons wouldn’t make any sense for professional and amateur radio receivers.
Because the sine wave is easy to define and replicate, but we may have different interpretations of “silence” – my children certainly do…!
Because then the faintest whisper would be +∞ dB.
Are log scales so hard to understand?
This isn’t readily apparent, as the most common exposure people have to decibels is that we measure sound pressure levels in “Db”, and on that scale 0Db *is* ‘silence’.
Dan: what you’re referring to is dB SPL, which is an acoustic measurement where 0 dB is defined as the the threshold of human hearing (roughly). In that context, it could be considered “silence”, but it is still possible to have negative dB SPL values – 0 dB SPL does NOT mean zero sound. But the real problem is that this is not an electronic measurement. There is no threshold of human hearing for electronic signals, since humans can’t hear electronic signals. And electronic equipment is particular about the maximum signal you give it, not the minimum.
Just the same, the closest you could come to having a meaningful electronic measurement, if you really, really hate negative numbers, is to just offset the dB VU scale by an arbitrary number like +100, so that 100 dB VU comes to 1 milliwatt. But most mechanical VU meters only have a measurement range of around 30-40 dB, so then you’d have a meter that indicates from 60-100 dB, and I’m not sure that’s real helpful. In fact, it would probably be misleading, since people would see 100 and think of this as a linear percentage scale, which it is not.
But seriously, are negative numbers really that hard to deal with?
“on that scale 0Db *is* ‘silence’.”
No it isn’t. 0 dB is the quietest sound a human can hear. An empty anechoic chamber with very good insulation from the outside world is -23 dB or so.
Because you can never reach absolute zero, in anything – it seems. (And why, at times in our lives, some of us stoop to headphones, set low, and in between stations for any masking gentle white noise.)
Over 60 and grew up with biannually changing lies about audio amp music equipment for home ir auto, power watt definitions and amounts. This was an interesting and enjoyabke bit of clarity. Do sorta wish we had heard a bit more of the orevious wire gauges and standards for mile-losses. Anyone???
Because you can’t raise 10 to any power to get 0.
This is a logarithmic scale, and no true zero exists, physically or mathematically!
Absolute zero temperature in intergalactic space comes close, but is still not exactly 0. Only the lack of a universe would measure at 0!
Crazy physics!
VU meters were very useful in most of the higher quality tape recording equipment of years ago. You would set the recording amplifiers to a level that would just occasionally peak into the red. Any higher and the recording heads would be over driven. If set too low, the noise floor of the tape would begin to be noticeable.
“Given the technology of the time, the definition of what exactly constitutes a volume unit was based on the characteristics of the moving coil meter. ”
It was a bit more controlled than that; the ballistics of the chosen meter were selected because they had a close correlation to the perceived loudness.
‘0’ on a VU meter did not correspond to the loudest level you can have before distortion. The zero point usually corresponded to a level that was somewhere between 12 and 20 dB below the distortion point, depending whether you were recording or broadcasting. The idea being that if your average signal drives the meter to near 0 VU, you have a reasonable expectation that the signal peaks did not drive past the higher distortion point.
The actual clip point of analog tape varies with frequency, tape speed, bias, tape formulation, eq, phase of the moon, etc, so VU meters worked just fine with those. Ditto for broadcasting, where you want to maintain a steady overall “sound” level, which the VU meter does well.
Digital recording has a very hard clip point, so peak meters are much more common there.
If you really want to laugh (in a sad sort of way) read the many discussions about the AES standards for peak metering.
Consider a digital audio signal, where the meter software would probably be expected to just look at each sample independently, and the highest (absolute value) one is the peak. Right? Well, if we consider that the samples are taken from a band-limited continuous time audio signal, then we have to interpolate between the samples to find the actual peak which (if you think about how band-limited interpolation works) may be higher than any individual sample. Yikes.
More entertainment can be had by reading the discussions about 0dBFS, which is the reference level for digital audio. Unlike the reference level for analog audio (where the 0dB level is typically many dB below clipping), 0dBFS represents the maximum level of the digital signal, just at the onset of clipping. But is that for a sine or a square wave? There is a 3.01dB difference between the two if they have the same p-p “voltage”, because a square wave has twice the power of a sine wave of the same amplitude.
It’s been a long time (decades) since I’ve read the standard, but I believe 0dBFS is defined in terms of a sine wave, which means you can produce a signal that is 3dB above the highest possible level, without clipping. Hmmm. (Or did they redefine the dB to work on voltages, rather than power to avoid this issue? I don’t remember.)
I just found AES-R7-2018 online.
The abstract states:
“Problems occur because the actual peak values of a sampled signal usually fall between sampling instants rather than precisely at a single sampling instant. This results in several peak-sample meter anomalies, including inconsistent peak readings, unexpected overloads, and under-reading and beating of metered tones.
In order to meter the maximum amplitude, or true-peak value, of a sampled signal it is necessary to over sample (or up sample) the signal, essentially using interpolation to increase the sampling frequency of the signal and thus recreating the original signal between the existing samples.
This report discusses criteria for the design of a true-peak meter and proposes appropriate over-sampling ratios to achieve true-peak metering accuracy.”
The Wikipedia dBFS page https://en.wikipedia.org/wiki/DBFS indicates that AES, IEC, and a subset of ITU-T standards use the sine wave as the 0dBFS reference, whereas a different subset of ITU-T standards use a square wave (in which case it’s called “dBov”).
Chip makers (e.g. ADC, DAC, CODEC, digital microphones, etc.) and DAW software will use either, which may lead to 3dB errors in level when interchanging digital signals. I no longer work in that industry, and I don’t know how the discrepancy is dealt with in practice.
The clip point of digital audio is an absolute: Thou Shalt Not Exceed 0 dBfs, else you are clipping, which is Bad. Or witihin 3 dB of clipping. The point being that you should NEVER be lighting the ‘over’ LED. So you have to be aiming to keep signal levels below that, which becomes a judgement call of the operator or engineer.
When considering in/out devices like digital recorders, DAWs, digital transmission, etc. and those devices have been set for unity gain (no net gain or loss from in to out) then the exact peak metering standard isn’t that critical. System level alignment is done with a tone well below 0dBfs (eg -20), and in operation, if you get back what you put in, and it didn’t clip… you won.
Yes and no. “Never” is a strong word. I allow applause to clip, because a clipped handclap is virtually indistinguishable from a pure handclap, and using my precious dynamic range for faithful reproduction of high amplitude noise seems wasteful.
Good point – a hard clip isn’t always fatal. But you wouldn’t allow a singer or a flute solo to ever light that peak meter’s “over” LED.
To bring this back to VU meters – if a sustained note from that singer or flute rolled into +2 on a properly set up VU meter, you wouldn’t panic, because you know there’s still several dB of headroom above that +2.
You can use 32-bit files in a 64-bit audio editor and achieve +770 dB of positive values and around -758 of negative. When rendering you can just avoid clipping. So o dBfs is not an absolute really.
Dan, I don’t know whether you’ll read this … but if you could do a similar piece on the goniometer (https://en.wikipedia.org/wiki/Goniometer_(audio)), I’d be thrilled.
It’s an old article but one of my favorites as a sound designer. The devil is on the details. Just some more food for thought for anyone visiting this post.
You can also check out about RMS measurement, the LUFS, the Bob Katz scale, and any research for loudness like the equal-loudness contour weighting from various labs, like CBS, etc.
It’s an interesting topic on how to measure audio.
My personal method is to measure and control my signals depending on the final use. Usually that involves a mechanical read like True-Peak, a biological read, like LUFS, and a simulated calculation in dBSPL, just to have nature in mind, it helps on my decision making process.
An excellent article, thanks!
Yeah, right? An oldie but a goodie.
I love seeing that LUFS has become sort of an industry standard in the last 4-5 years. (It’s an _actual_ standard in
European broadcast media.) It makes my life, as part-time producer of the Hackaday podcast, super easy.
Yes, I totally agree, for long material in production pipelines it’s very good that we have a way to anticipate the listener’s experience.
It would be lovely to see that in other sound characteristics.
The writer of the article doesn’t really understand the units used, and quotes the wrong standard as a reference. A level of 775 mV into 600 ohms generates 1mW of power. This is the standard.
As he pointed out above. For 0 dBm !!!!! ( 0dBu if you don’t say that this voltage is driving a particular load, so no wattage is quoted. ) This is -4 VU. NOT 0VU!!!!!
0VU is +4 on the dBu scale. 1.228v. ( around 2.5mW of power into a 600 ohm load, if that is useful…)
Now, seems bit mad, doesn’t it? Why move the scale by 4?
Well, if you use meter movements that are simple to make and are pretty rugged, you will find that no matter how sensitive you make it, .775v AC going into the meter, and fighting it’s way through the germanium diode bridge rectifier, hasn’t got enough voltage left to drive the meter to that nice ‘two thirds’ sort of place on the scale that we like. If you put more turns of finer wire on the armature to make the meter move more for a set current, you find that the resistance has risen so there is not enough voltage to drive the required current through the coil.
If you use fewer turns of thicker wire, you can get the needle to move to the right place, but the meter’s impedance loads the line too heavily……and you start to hear the rectifier diodes distorting the waveform……
Plain physics gets in your way.
So, they all gave up, shoved in 1.228, or +4dBm, via a resistor so the line isn’t loaded too much, and this put the needle in a nice place, and they called this ‘0VU’…………….
When I get to +3 VU on an old Neve console, I know there is at least TWENTY dB headroom left.
TWENTY.
Some old gear can chuck out +30VU…..which of course is why it’s so criminal to put the output of a V76 straight into the fresh air of Protools…..it’s running at least 12dB down on what it can do.
Hammer it into a low impedance 10dB pad first and hear it actually do some work…..
Headroom on the mic stage of an old SR console is 36dB…….!!!