
Usually, with Circuit VR we look at some circuit in detail with simulation — usually LTSpice. This one will be a little meta because I wanted to look at a capability in LTSpice which ironically is very useful, but not often used. Along the way, though, we’ll look at why you get maximum power transfer when your source impedance matches your load impedance. This is something you probably already know about, but it is interesting to look at in simulation if you know how to coax LTSpice — no pun intended — into showing you a meaningful graph.
The circuit is super simple. An AC source and a 50-ohm resistor stand-in for a 40-meter ham transmitter. With 100 volts into a 50-ohm load. So far, so good.
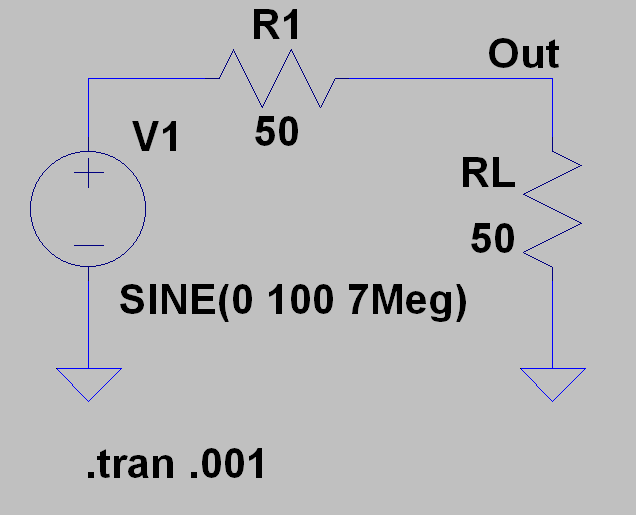
If you look at the peak output voltage and current, you’ll see the load sees 50V (half of the source) and, of course, with a 50-ohm load, 1A of current for a total of 50 watts. If you compute the RMS voltage you can easily find the RMS power, as well (25 watts). Spice will even plot power for you if you use Alt+Click on the schematic — that requires some reconfiguration on some Linux setups where Alt+Click does something else. You can also plot an expression like:
V(Out)*I(RL)
The bad part is the plots that result have a pretty fixed format: some parameter versus time. Sure, you can do math on the Y-axis, but you are always plotting against time. That’s not bad when you have just a single simulation, but what if you want to look at antenna loads ranging between different values?
Comparing Simulations
It is easy to set up Spice to do multiple simulations for comparison. Just change RL’s value from 50 to {R} and add the following line as a Spice directive somewhere on your schematic (you can press S to do that or pick it from the edit menu or the toolbar) :
.STEP PARAM R 1 200 10
This tells Spice to vary R from 1 to 200 in steps of 10 ohms. Now the plot is a mess, even zoomed in.

in LTSpice you can right click on the plot and select one or more steps to go through but when you have a lot, that’s a nightmare. Besides, this is an easy trend to spot, but it would be nice to have a plot of power versus RL.
The answer is the .MEAS or .MEASURE statement (you can shorten it if you like, but you can also use the whole word). There are actually two forms of the .MEAS command. The first one computes a single value. If you use a simulation value it will just pull the latest one, but since there’s only one value that might not be what you want. In our case, though, I’d like to know what the SWR is and the .MEAS command is just right for that.
SWR: Standing Wave Ratio
The reflection coefficient takes this command:
.MEAS Reflect param (R-50)/(R+50)
This works because R doesn’t change during one simulation run and the param keyword tells Spice to look for that kind of variable. Reflect is like a variable name. It could have been anything.
Then computing VSWR (voltage standing wave ratio) is easy:
.MEAS VSWR param (1+abs(Reflect))/(1-abs(Reflect))
The data for these measurements (Reflect and VSWR) will show up in the Spice error log even though they aren’t errors. You can view it from the View menu or just press Control+L.
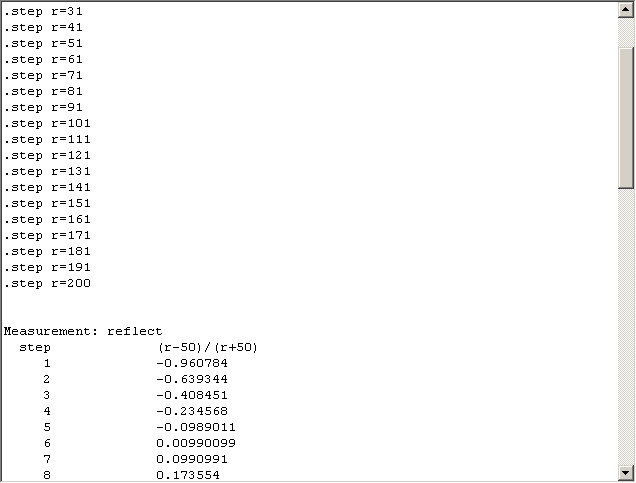
You can see there is a single value for each step of R. That isn’t a very handy format, but we’ll do better in a minute.
Spice Power
To compare power, we’ll get the RMS power for each run. That’s the second form of .MEAS. You can put certain operations in to look at all the simulation data from a run and do a calculation on it, again collapsing it to a single number. In our case, we’ll use RMS:
.MEAS Vrms RMS(V(Out))
.MEAS Pout param Vrms*Vrms/R
Note you can enter these both at one time using the Spice directive command. Just press Control+Enter to start a new line for each directive. Or you can enter them one at a time if you prefer. Also, don’t forget after you set the text you still have to place it on the schematic. Now if you run the simulation, you’ll have a table of data for Vrms and Pout, as well as the Reflect and VSWR.
The Plot Thickens
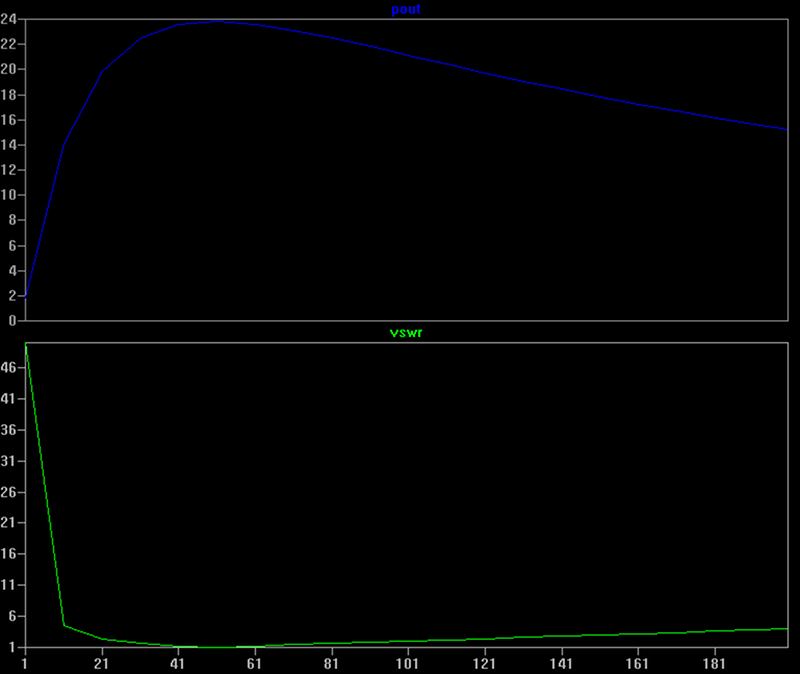
Now what you really want is to get a plot of power out and VSWR vs the resistance. To do this, you have to pull up the error log (Control+L). Then right click in the log. If you have .MEAS statements, a menu item will be available that says “Plot .step’ed .meas data.” Opening that will give you a blank plot window.
You can right click to add traces and you’ll see the data there: Reflect, VSWR, Pout, and Vrms. You can add them like you would any other plot and do the usual things with them. But the X-axis will be the step value, just like we wanted. Here’s a plot split into two panes showing the VSWR and power. As you’d expect, at 50 ohms you get a VSWR of 1 (which indicates 1:1) and that’s where you get your peak power, as well.
There is one caveat. Unlike a normal plot, one you produce this way will not update when you rerun the simulation. You’ll have to recreate the plot by hand if you rerun the simulation. Incidentally, if you are just trying to get .MEAS data and you are doing a lot of steps, you can reduce the amount of time you are waiting by not saving all the data. It also helps if you clear the normal plot pane so you don’t spend a lot of time redrawing.
Here’s the final schematic. You can download the files, as usual, from GitHub: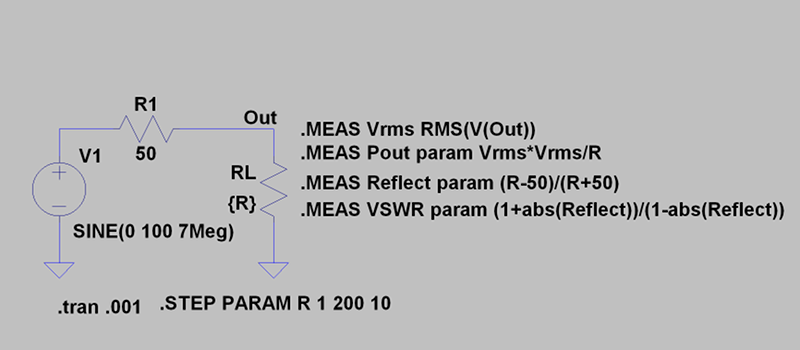
And Then…
There’s plenty more about the .MEAS command. You can have it pick a value when a certain condition hits or pick out a range of values. In addition to RMS, you can get the average, minimum, maximum, and peak to peak value. You can also print out single values which can be useful if you want a value when some condition hits. You can also make the measurement only valid for a certain kind of analysis (like a DC or a TRANS). You can read all the details on the help page. But I find I don’t use much of those features since everything gets plotted on the screen now, anyway.
We’ve talked some about impedance matching before, by the way. In this case, the result wasn’t as interesting as the way to get LTSpice to create the right plot. We looked at basically the same circuit before (at DC and without the nice graphs) and discussed Thevenin equivalence (which this is an example of) quite some time ago.


You can also use LTSpice to calculate S-parameters as well, which is a bit of a hidden trick. First, instead of having an exterior series resistance, define the AC source as having a series resistance (e.g. 50 ohms). Then, as here, have a load resistor as well, and then use the .net directive to create a name for the current through the load resistor: so, for instance “.net I(RL) V1” or similar.
Then after you simulate, when you add traces to the plot you’ll see a bunch of S-parameters (and Y, Z, H too) as options.
“… maximum power transfer when your source impedance matches your load impedance.”
Widely misapplied and misunderstood, this is one of those sayings like “current takes the path of least resistance.”
I’ve heard a lot of techs parrot the misinformation that the output impedance of an audio amplifier is 8 ohms, because the speaker is 8 ohms. In fact, amplifier output impedance is often a fraction of an ohm. Who wants to burn up half of the power in the source? This is also a matter of speaker damping, so that the speaker cone movement will match the output of the amplifier with as little overshoot and ringing as is reasonable.
The maximum power output of a switch mode or linear power supply is NOT when the load impedance and source impedance match. Again, the source impedance is, by design, very low. The maximum power point is when you reach the maximum design current and voltage output.
A class C RF output stage is designed to work into a 50 ohm load. It does NOT have a 50 ohm source impedance, for the same reasons listed above.
Yeah that used to break my head at 12, and when I’d ask questions, I’d get the parrot. Mentally resolved it by calling it design impedance in my head and found a better rule of thumb of input impedance should be 10x actual output impedance, but still without good explanations. Curiously, I’ve not really had to think about it much, so never really got to the bottom of it.
What confuses people is the difference between maximum power transfer and maximum power efficiency which are two different things. Depends on if you are looking at the system or the load. But this is a standard saw in EE class when learning about Thevenin. When you have a nonlinear output it all goes wonky anyway, which is most often the case. You also have to balance SWR. But my whole point here is that LTSpice will do the power math for you.
See: https://en.wikipedia.org/wiki/Maximum_power_transfer_theorem#Maximizing_power_transfer_versus_power_efficiency
Yes, Spice is a powerful analysis tool, as long as you understand the limitations.
“The maximum power output of a switch mode or linear power supply is NOT when the load impedance and source impedance match. Again, the source impedance is, by design, very low. The maximum power point is when you reach the maximum design current and voltage output.”
Um, no? I mean, this is really basic electronics. If you have a 5V battery with an internal resistance of 1 ohm, the most power that the load can dissipate is 6.25W, when its load resistance is 1 ohm too. That’s the maximum output power. Period. Full stop.
Just work it out. If the load resistance is 0.5 ohms, the load draws more current (3.33 amps vs 2.5 amps before), but it’s less power, because the voltage has dropped: it’s now only burning 5.55W.
If the load resistance is 2 ohms, the load is drawing less current (1.67 amps), and while the voltage drop is lower, it isn’t enough to make up the difference – it’s only burning 5.55W again.
In a real active device (like a switching regulator) you’ll very likely burn everything up well before that point, so the maximum possible power delivered to the load is unimportant (plus most electronic loads want a stable voltage, obviously, which means low output impedance). But it is absolutely true with, say, a solar panel, which is why MPPT trackers exist which act as impedance transformers to match the load impedance seen by the solar panel and then deliver the power efficiently (with a low output resistance!) to the battery.
“A class C RF output stage is designed to work into a 50 ohm load. It does NOT have a 50 ohm source impedance, for the same reasons listed above.”
Because it’s designed for transmission, where *efficiency* matters. Normal RF gain blocks are designed with 50 ohm source and load impedance, because they care about power transfer, because any power that’s not transferred to the load means a higher overall noise figure.
I think you are missing my point. I am not saying that mathematically it is incorrect, when considering ideal voltage sources. I’m saying it has no bearing on real-world devices.
Did you miss the part where I mentioned solar panels and batteries? Not to mention amps and antennas themselves. Real ones, not ideal ones. Antennas themselves are basically impedance transformers to match free space’s 377 ohms to the load.
The key here is that if you’re trying to deliver power efficiently (because you’re generating it), you use a low source impedance (relative to load). If you’re trying to deliver the most power (because you’re receiving it), you match it.
“Um, no? I mean, this is really basic electronics. If you have a 5V battery with an internal resistance of 1 ohm, the most power that the load can dissipate is 6.25W, when its load resistance is 1 ohm too. That’s the maximum output power. Period. Full stop.”
That is what I was responding to.
You don’t match impedances to deliver the most power. You design the circuit to have low enough impedance to supply the required power. If I need more power out of a battery, I don’t load it down until the voltage drops to half, I use bigger cells or put cells in parallel.
That’s you, but an RF engineer has to consider reflections because any time the impedance changes, it creates standing waves out of reflected signals. This makes the circuits ring and generate extra noise, which is detrimental to the actual use.
In other words, if you made an RF amplifier and wanted to dump more power out to the load, you could design it with lower output impedance, but then you’d distort the signal. For audio amps this hardly matters because audio signals are so low frequency (long wavelength) that they effectively can’t make standing waves over a few feet of wire, so you can get away with terrible impedance mismatches.
Try this, a simpler approach:
Version 4
SHEET 1 880 680
WIRE 16 112 -16 112
WIRE 160 112 96 112
WIRE 272 112 240 112
WIRE 304 112 272 112
WIRE 416 112 384 112
WIRE -16 160 -16 112
WIRE 32 160 -16 160
WIRE 32 192 32 160
WIRE -16 208 -16 160
WIRE 416 208 416 112
WIRE 416 208 -16 208
FLAG 32 192 0
FLAG 272 112 load
SYMBOL voltage 112 112 R90
WINDOW 0 -6 56 VBottom 2
WINDOW 3 7 56 VTop 2
SYMATTR InstName Vsrc
SYMATTR Value 100
SYMBOL res 144 128 R270
WINDOW 0 18 8 VTop 2
WINDOW 3 13 109 VBottom 2
SYMATTR InstName Resr
SYMATTR Value 50
SYMBOL bv 288 112 R270
WINDOW 0 9 56 VTop 2
WINDOW 3 -32 56 VBottom 2
SYMATTR InstName Brld
SYMATTR Value v=50*i(Blod)*(time)
TEXT 80 152 Left 2 !* Max power transfer demo\n* Match load to esr\n.tran 0 32
Oooops, i goofed.
Corrected ckt:
Version 4
SHEET 1 880 680
WIRE 16 112 -16 112
WIRE 160 112 96 112
WIRE 272 112 240 112
WIRE 304 112 272 112
WIRE 416 112 384 112
WIRE -16 160 -16 112
WIRE 32 160 -16 160
WIRE 32 192 32 160
WIRE -16 208 -16 160
WIRE 416 208 416 112
WIRE 416 208 -16 208
FLAG 32 192 0
FLAG 272 112 load
SYMBOL voltage 112 112 R90
WINDOW 0 -6 56 VBottom 2
WINDOW 3 7 56 VTop 2
SYMATTR InstName Vsrc
SYMATTR Value 100
SYMBOL res 144 128 R270
WINDOW 0 18 8 VTop 2
WINDOW 3 13 109 VBottom 2
SYMATTR InstName Resr
SYMATTR Value 50
SYMBOL bv 288 112 R270
WINDOW 0 9 56 VTop 2
WINDOW 3 -32 56 VBottom 2
SYMATTR InstName Brld
SYMATTR Value v=50*i(Brld)*(time)
TEXT 80 152 Left 2 !* Max power transfer demo\n* Match load to esr\n.tran 0 32
I know I’m necroposting, yet to people came here from web search
you don’t need to do all this complicate dance
Do this
.net I(R_LOAD) Vsource
then plot vswr
(1+abs(S11(Vsource)))/(1-abs(S11(Vsource)))