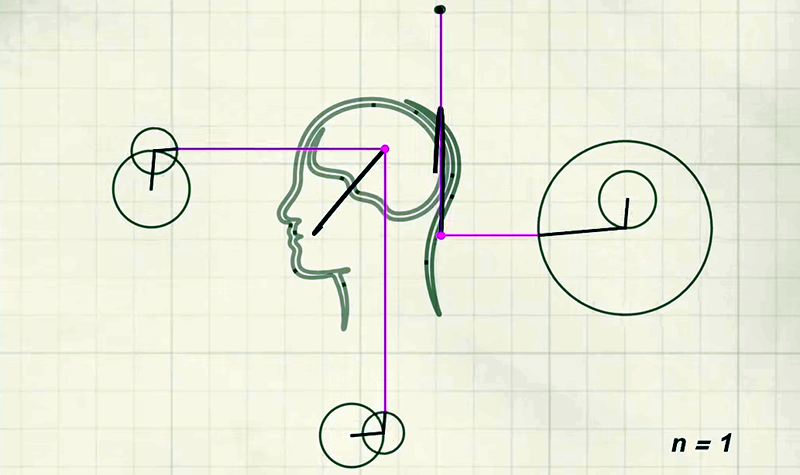
One of the nice things about living in the Internet age is that creating amazing simulations and animations is relatively simple today. [SmarterEveryDay] recently did a video that shows this off, discussing a blog post (which was in Turkish) to show how sine waves can add together to create arbitrary waveforms. You can see the English video, below.
We’ve seen similar things before, but if you haven’t you can really see how a point on a moving circle describes a sine wave. Through adding those waves, anything can then be done.
The original post’s author, [Doga] is a student at Georgia Tech and [SmarterEveryDay] actually visited him to get a live demo. The software used was Mathematica.
Perhaps the most interesting thing, though, was when [Doga] took on a challenge to draw a complex logo using a Fourier series. He simply digitized the X and Y coordinates and then decomposed the resulting functions. It reminded us very much of how you can draw a Christmas tree on an oscilloscope.
This isn’t the first video we’ve seen on the topic. We’ve seen the same thing done with MATLAB. But the Fourier transform is so fundamental to electronics and many other disciplines, that it is worth learning about or reviewing, plus we just love the cool animations. If you want to try your own hand at it, here’s an English blog post from earlier this year by [Alex Miller]. At the bottom of the post is a link to an online workbook that you can try yourself.


Okay, so Destin gives two examples of curved shapes (functions) that are deconstructed (analyzed) into sine waves – the one that was given to him as an exercise, and the one he gives to Doga, and in both cases he shows the reconstruction (synthesis) of the original curves. But in neither case does he show the process! It’s just “step 3: profit”.
In truth, it’s not that difficult – you just multiply the original function by a sequence of sine and cosine waves, summing the result at each sampling point so that you get a single number for each wave. Okay, it’s slightly more complicated than that, but not by much, but the point is, you get the magnitude and phase of each frequency component that’s present in the original function. My point is, why does everybody hand-wave the part that does the work??? Doesn’t that just reinforce the general belief that it’s all magic?
I love Destin’s videos, but what the heck?
I like this video more ( https://www.youtube.com/watch?v=qS4H6PEcCCA ) because it gets into a bit more of the details of the Homer Simpson’s orbit.
Brilliant, but still loses anybody not intimately familiar with mathematese, like e^(i * n * pi).
Didn’t 3bkur 1 Black do a good single episode and series on it?
3bkur1black sounds like some kind of knock off of 3blue1brown. Like Abibas.
Euler’s formula which was derived using the Taylor series (Maclaurin series) for sin and cos is scary but if you look from above and ignore all the maths and just picture it as a simple way to write cartesian coordinates as polar coordinates or the reverse. That is it a just one property of Euler’s number (e), just like π has many properties.
I actually understand that, having been through the full course of a BSEE program, but those complex exponentials still make my brain stop, as soon as they show up. I am perfectly fine with (sin x, cos x), but throw i in there and make it e^(i * pi), and things just go all fuzzy. Luckily I was already well acquainted with Fourier transforms when we got to that part, so I didn’t flunk anyway. I’m serious. It’s as if suddenly all of the symbols are squiggles I don’t even know the names of, and even the digits might as well be base 7 at that point. The mathemeticians got a hold of engineering one day, and said, “let’s make things simpler, by using complex numbers!” They really did that. I mean, REALLY. I know what e^x looks like when x 1, but when x is “perpendicular” to 1, suddenly it’s periodic? HUH?? Bye, bye. Yeah. I really do understand all of these things; I even understand that the circles being drawn in the video are showing energy rotating from real to imaginary and back (or potential to kinetic energy and back, or whatever), but they simply DO NOT MAKE SENSE to a visual mind when written that way.
Daniel Shiffman just made a nice programming tutorial about Destin’s video: https://www.youtube.com/watch?v=Mm2eYfj0SgA
This is the best example of all of these, since it uses notation that non-mathematicians can understand, like for loops instead of integrals. But it still only does the synthesis side of the picture, i.e., converting data from frequency domain to time domain. What’s still missing is the analysis side, which converts from time domain (i.e., a set of samples in time) to frequency domain (a set of amplitudes and phases over the range of frequency).
That would be Fourier transform and not Fourier series then, would it not? I’m still learning so I’m not sure..
That would be Fourier transform and not Fourier series then, would it not? I’m still learning so I’m not sure..
The Fourier series is the equation that describes a function as a series of sine waves. The Fourier transform is the mathematical process used to calculate a Fourier series.
That makes sense. I think I get it now.
I would amend that to say the Fourier Series can describe any piecewise continuous function. The Fourier Transform is the same function represented in a frequency domain or space. The calculation or computation is an algorithm, like the Discrete Fourier Transform or the FFT. The DFT’s/FFT’s are less than ideal because they are approximations of the Fourier Transform, which has an infinite number of frequencies.
When I first ran across this I pictured it as a series of filters or masks (correlations) for the input signal. Plot the signal and plot a sin function of amplitude 1 at some frequency, like the highest you expect to find. Multiply the signal points and filter points (sin theta) one at a time and add them up. Do it again for the next frequency. When the sin function and the signal have parts that match, the result is bigger.
This is nearly the same as a “matched filter” or optimal filter. The best filter to find a signal in noise is a copy of the signal you are looking for multiplied by the received signal and done in the same way, point by point. Do it again every time you get a new point. By the way, there is a best signal for detecting in noise, and it is a “chirp”. I think you can also prove that a signal that is good pseudo noise is also optimal or nearly so. The Fourier Transform is then a bunch of these filters – one full filter process for each point in the transform.
You need complex numbers in order to recover the phase. The sin and cos part of the complex number are 90 deg to each other. That means you will never get a zero result when multiplying like you will with sin or cos alone. When sin(theta) is zero, cos(theta) is one, etc. They are the In-phase and Quadrapure (I/Q) part of signal processing and SDR. The root(-1) that labels one part of the complex number is carried in the computer’s imagination :-) It is just there to make the multiplication of complex numbers come out right.
This guy’s vids are good also. https://youtu.be/r18Gi8lSkfM
You can spend your career in electronics and don’t have to know how to do a FFT by hand or how it works. This doubly applies to makers.
But if you want to learn it, make sure you have a couple years of college level math under your belt. Anyone else need not apply.
This is the most offensive elitist comment I’ve heard in quite sometime.
I know highschool students that can run rings around some “college level” dunces.
But – I guess if it makes you feel superior to the peasants, have at it.
(and, not to brag, but I hold a PhD EE, and a BS in civil engineering with a state P.E. license – I work in the electric power industry).
My point, above, is that it doesn’t have to be this way. I learned about Fourier analysis before I learned a single thing about calculus, and it’s NOT DIFFICULT, as long as you don’t let yourself get mired in the notation of mathematicians. I realize that once you take several years of college-level math, the integral expressions of exponential functions can start to have some value in visualizing what’s going on, but I find this to just be a brick wall to anybody who hasn’t taken the years to make this familiar enough to NOT freak them out.
In real (analog) life, the mathematical notation doesn’t show, because there are no components in electronic circuits, nor symbols in any (sensible) programming language that can possibly be this confusing.
Look at how a direct-conversion radio receiver works. The signal being received is mixed with a local oscillator set to the carrier frequency of the signal, and the resulting mess (the sum and difference frequencies of all signals present at the antenna) is sent through a low-pass filter to eliminate everything except the difference component for the selected frequency. This results in a signal that corresponds to the amplitude of the frequency (of the local oscillator) component of the received signal. That’s what happens electronically, and most people can understand this without too much difficulty. I know this because I taught people this in the Air Force. Now look at what’s happening mathematically: the local oscillator is just a generator of sine waves, and the mixer is multiplying that by the signal being received. The low-pass filter is mathematically taking the integral of that over a period of time. So we receive specific radio signals by multiplying the input from an antenna by a sine wave at the frequency we want to listen to, and then integrating the result. This, mathematically, is a single-point discrete fourier transform.
Now do the same thing with a spectrum analyzer. Don’t freak out – this is easy. A spectrum analyzer can be made out of a direct-conversion receiver whose local oscillator is swept over a band of frequencies. Note that I’m talking about an old-school spectrum analyzer, not a software based one that does FFT analysis. As the local oscillator sweeps, we see, over a period of time, the amplitudes of the various frequencies present at the antenna, and when this is drawn on a CRT screen (remember, old-school), we see a frequency-domain plot of the input. It’s really just that simple.
What a discrete Fourier transform does (and the FFT is just one algorithm for quickly doing discrete Fourier transforms) is to analyze the whole set of sample data for each of the frequencies in the band. This allows the analysis to happen in real time, where an old-school spectrum analyzer only detects each frequency at the instant it is analyzing that frequency. For an analog spectrum analyzer to show fourier transforms in real time, it would need a separate local oscillator, mixer, and low-pass filter for each frequency being displayed, which would quickly get impractical as the frequency resolution was increased, but digitizing the signal and doing the math in a fast computer makes this cheap, these days.
I feel like I should make a video of this, but it seems like a lot of work, doing all of the required animation.
Thank you, sir, for this comment.
I full heartedly agree – and would like to add that A LOT OF THINGS(tm) are a lot easier than they look from the outside, because people who make their money from it OR people who like seeing themselves as something more impressive than others try their best to mysteriarize the topic (if “to mysteriarize” isn’t a word yet, it’s definition is: Make however unadvanced technique look as magical as possible by confusing the hell out of people with technobabble or maths).
One possible answer to WHY there aren’t many good explanations (especially in the garbage bin called “YouTube”) is EXACTLY that making GOOD explanatory videos takes a shitload of time.
I had a professor who liked to talk about “maximizing the boolean variable” (set to 1) or “minimizing the boolean variable” (set to 0). That always annoyed me.
Or you could go all analogue and look at a mechanical device like the harmonic analyser from 1897 https://www.youtube.com/watch?v=NAsM30MAHLg which could analyse up to 20 sinusoidals. The second video explains how it works ( https://www.youtube.com/watch?v=8KmVDxkia_w ), but I thought I’d point you to the first video because they are by the engineer guy which are always fascinating.
I’ve seen this series, and it is wonderful. I wish I remembered this when trying to describe the essential simplicity of the Fourier transform. There’s nothing more instructive than a machine built in such a way that you can see all of the inner workings. This machine does indeed demonstrate what I’m talking about, where multiple frequency components are being evaluated simultaneously. The most beautiful part, though, is that it demonstrates the reversibility of the Fourier transform, in that the same mechanism is used for both frequency->time and time->frequency domains.
I did Fourier analysis of Polaroid photos of waveforms from my home-made oscilloscope (an old TV set) when in high school. I didn’t know calculus, but understood that if I chose points sufficiently close together for my digitization I could get a meaningful result, which I calculated with sine tables, slide-rule and adding machine. This was at a time early enough in the history of computation that I had no computer available, and Cooley and Tukey had not yet rediscovered the more-or-less lost FFT algorithm. https://en.wikipedia.org/wiki/Fast_Fourier_transform#History
Now THAT’s old-school! It reminds me of my first photo scanner. This consisted of a typewriter, a slide projector, cadmium-sulfide photocell, and an ohmmeter. The photocell was placed on the paper bail behind the paper roller, and the photo to be digitized was put in the slide projector and aimed at the typewriter. A scale of “A” to “F” (or something) was affixed to the ohmmeter scale, and each line was scanned by typing the letter indicated, which both recorded the value and advanced the carriage so that the photocell was moved to the next point in X in the projected image. At the end of each line, the photocell had to be manually moved up the paper bail by 0.1″ to get square pixels.
Can’t wait that video already.
This ^
I’m speechless at this method and not to mention hats off to Fourier!!!