Many of us don’t think too much about radiation levels in our area, until a nuclear disaster hits and questions are raised. Radiation monitoring is an important undertaking, both from a public health perspective and as a way to monitor things like weapon development. So why is it done, how is it done, and what role can concerned citizens play in keeping an eye on things?
Who Is Watching?
Most countries have a series of government-run stations set up to monitor atmospheric radiation, as a general part of environmental protection. Day to day, the data may not be particularly interesting — reporting on background radiation with little or no fluctuation. But these stations prove invaluable in the case of emergency events, where they provide the means to check the spread of radioactive material through the atmosphere. Atmospheric data collected by these organisations is often used in concert with soil and water samples in the event of a crisis, to help authorities determine safe zones and protect the populace from excessive radiation exposure.
The French organisation Institut De Radioprotection Et De Sûreté Nucléaire has been active in past nuclear accidents, helping to track and model the spread of radioactive material. Their measurements have been used to develop models of the Chernobyl plume, and they have undertaken significant research into the Fukushima disaster. Broader European monitoring is undertaken by EURDEP, whose site was often unavailable at the time of writing.
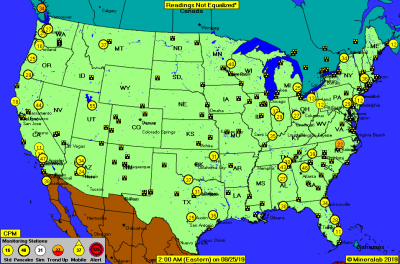
The United States has its own network of radiation monitors. It operates under the RadNet banner via the Environmental Protection Agency.
Some of these groups allow near-live monitoring of the collected data, via web interfaces. Other smaller players include RadiationNetwork.com and the Nuclear Emergency Tracking Center.
Skyfall and the CTBTO
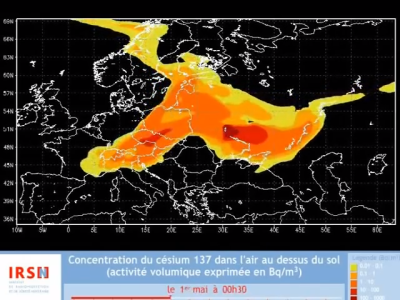
Another major player on the world stage is the Comprehensive Nuclear Test Ban Treaty Organisation, or CTBTO. In charge of a vast worldwide network of over 300 stations, they monitor radiation levels, and field a broad suite of other sensors designed to help track evidence of nuclear testing worldwide. The organisation made the news recently, as Russian-operated monitoring stations went offline in the aftermath of the recent Skyfall missile test malfunction. Unlike other groups, the CTBTO does not openly allow access to data collected from their stations. However, they occasionally publish material of public interest. In the case of the Skyfall incident, they published this modelling showing the expected flow of the radiation cloud, as well as seismic and infrasound data from the initial explosion.
Who’s Watching the Watchers?
State actors may often try and cover their mistakes, and with government monitoring stations mysteriously going offline, the valiant hacker may wish for an independent source for such data. Several such projects exist, collecting data from citizen scientists who own and operate their own monitoring hardware. While these stations are free of the shackles of government ownership, they have their own set of problems. Being operated by individuals on a hobby basis, uptime is not guaranteed. Many stations have large gaps in their data collection, as the owner has left the device unplugged, or repurposed a Raspberry Pi for another project. Additionally, there is no way to verify the quality of the data. Readings must necessarily be compared to an average baseline for the area. If a station is moved, even simply from inside to outside a dwelling, this can affect the baseline reading and thus create confusing spikes and variation in data. There’s also very little to stop dedicated malicious actors from hacking such devices, too.
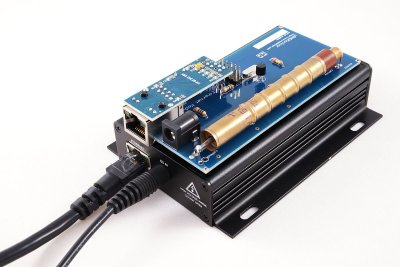
Despite this, anyone wishing to contribute to such a monitoring network can get started quite easily. With little more than a Raspberry Pi and a simple Geiger counter kit, it’s possible to create a station not altogether that much different from what some of the more basic government stations are running. While these tools don’t enable the monitoring of precise isotopes in the air and detailed analysis of nuclear events, they can clearly measure the background radiation levels in the area and determine spikes above the mean.
One of the most well-known monitoring networks is uRADMonitor, which was a Hackaday Prize entrant in 2015. The network features data from across the world, with most stations concentrated in Europe and North America. Stations are run by individuals, fielding a variety of hardware — sometimes with additional sensors for monitoring air quality and other environmental factors on board. It’s even possible to graph data from individual stations, picking individual date ranges for exploration. Some of these tools are buggy, but are workable for those who persevere.
Radmon is another site purposed with the logging of such data. Unlike uRADMonitor, Radmon sticks to a clear focus on radiation monitoring only. While its site is of a more basic construction, it has features more attuned to the scientific set. Graphs from individual stations are drawn in a clear and easy to read format, and raw CSV data can be downloaded from up to the last year.
Adventures in Data: Taking Community-Source Data on a Test Run
As an excercise to determine what was possible with these tools, I went on the hunt to see if I could find evidence of a radiation spike from the Skyfall missile incident. This was much frustrated by the many different web interfaces used by different monitoring networks, as well as buggy sites that wouldn’t accurately show data from past date ranges.
After much effort, results were weak. Many stations had huge gaps in collected data, or all manner of scattered and unlikely readings. Unchanging, exact readings that remain constant over many days are evidence of a faulty detector or network setup, as radioactive decay is one of the more random forces in the universe. Other stations had large shifts in their background level at various points, suggesting perhaps the measuring device was moved under a windowsill or inside a house. Such shifts make it difficult to tease out any real data.
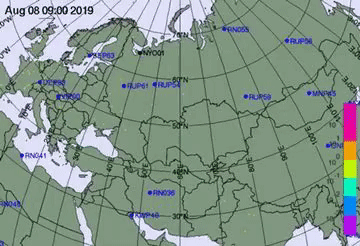
What we wanted to see was a series of spikes at detection stations in the days after August 8, coinciding with the travel of a radioactive cloud across Europe. As per the modeling from CTBTO above, it’s perhaps unsurprising we found little — the expected cloud was projected to largely circulate above Russia, where there are few, if any, monitoring stations sharing data with the public.
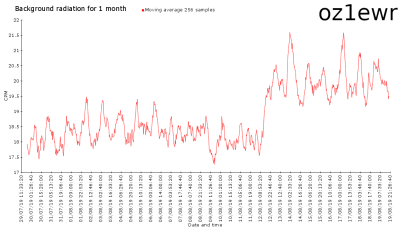
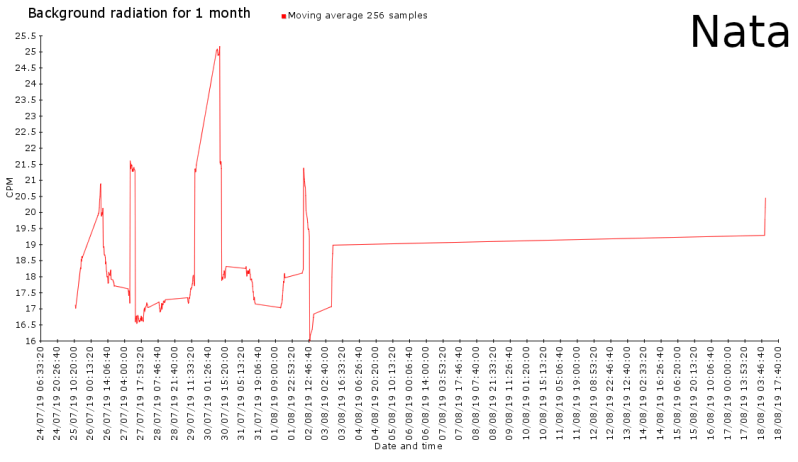
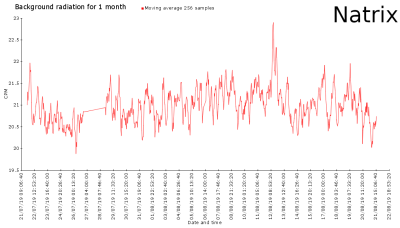
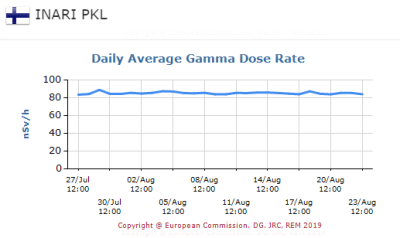
We found just two spikes — at detection stations Natrix and oz1ewr, on Radmon. Natrix is a detection station located in Sweden, with a clear spike on the 12th of August. The spike is a clear outlier, being the highest recorded level in over 3 months. At oz1ewr, located in Denmark, the rise in detected radiation is more significant, but also is not so much a spike as a rise to a new mean. However, none of the other monitors in Western Europe, across Radmon, uRADMonitor, or EURDEP, showed any significant spikes that we could find.
Unfortunately, in the absence of corroborating data from more stations, it’s difficult to conclude that what I found was direct evidence of a radiation cloud from the Skyfall incident. More likely, two out of the several hundred stations in Europe individually experienced a local event that was completely unrelated. What this search has shown us is that there is value in radiation monitoring, both on an individual level. It also serves as a great example of why networking these sensors is useful. Despite this, it also indicates that there is a strong need for rigor and care to be taken in any environmental monitoring, lest the collected data become obfuscated and useless among the noise.
Conclusion
While we may not have found what we were looking for, I hope that these open source monitoring networks continue to proliferate and improve. They may just serve as a vital tool in what has become a newly-energised nuclear age. If you’re thinking about running your own monitoring station, consider carefully how you will implement and maintain it in order to generate as much useful data as possible. If you’re a web developer on either a government or open-source project, consider how best to make data available to those who will be trying to find the mean in the numbers. And, if you’re on the nuclear engineering side of things, try to make sure you get it right first time, as second chances are rare. Good luck out there!


I’m wondering about the data…
If it were all stored on a cloud site (e.g. Google), I think that data would be susceptible to a government “shutdown”.
If stored locally, how do we access all of it, and along with the reliability concerns of the individual (person, detector, data storage), it too could be shutdown by a government (it would hard to keep anonymity).
Also, standards for the data, such as:
sieverts, rads, whatever,
collection frequency,
accuracy (and precision) of the measurements.
And maybe the most important, dissemination of any significant readings.. (the sky is falling!).
I wish there was a meta voting system that would allow a thumbs up/down sort of vote on the piece in general… this was well-written, informative, and all that good stuff… but I don’t really have anything to add (but I’ll add it anyway! :)) With so many stories floating by it’d also help to filter those that I might have missed the first time ’round that have lotsa love (or not, which can be just as illuminating….)
Montoring.
B^)
Minotauring!
Don’t forget about Radioactive@Home (http://radioactiveathome.org/map/) maybe is a bit forgotten but sensors are still going strong and measure radioactivity around the world
Connecting sparse data with lines is pretty misleading. Most packages that have plotting don’t have good ways to plot points. They often use points that are way to big or made of square and triangles and other nonsense (I’m looking at you Excel and similar). Nonetheless, putting lines implies you have data where there is none. I’m a’gin it!
Good article, but Im left wondering if there is a good (ie working well) solution for local detection (to what range?) that I can optionally share to a network (not the other way around necessarily) ?
On CCCamp19, I built me one of these: https://mightyohm.com/blog/products/geiger-counter/
I plan to add MQTT via an ESP8266 when I get around to it.
Was the release of radiation big enough for detection with a simple Geiger tube at that distance? Don’t know much about radioactivity, but if this event would noticeably increase background radiation in countries like Sweden, wouldn’t it be a major nuclear disaster?
There is a big open source data/tools/committee at https://blog.safecast.org. With fixed and mobile devices.