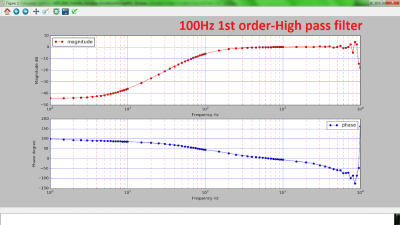
Electrical engineers will recognize the Bode plot as a plot of the frequency response of a system. It displays the frequency on the x-axis and the phase (in degrees) or magnitude (in dB) on the y-axis, making it helpful for understanding a circuit or transfer function in frequency domain analysis.
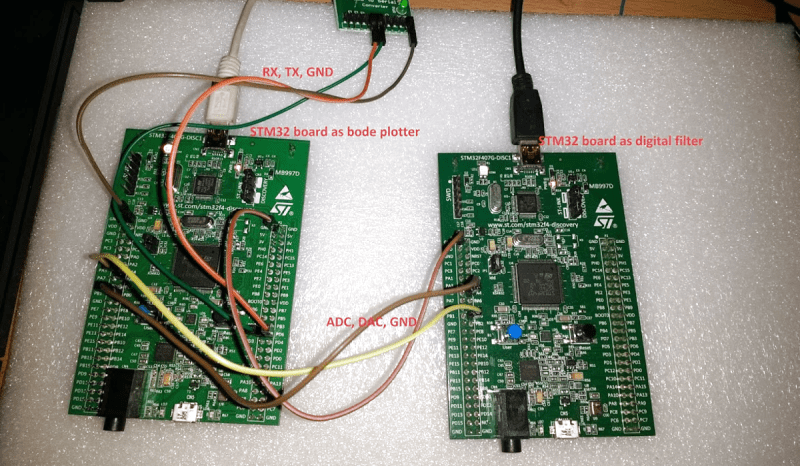
[Debraj] was able to use a STM32F407 Discovery board to build a Bode analyzer for electronic circuits. The input to the analyzer is a series of sine wave signals with linearly increasing frequency, or chirps, preferably twenty frequencies/decade to keep the frequency range reasonable.
The signals from a DAC are applied to a target filter and the outputs (frequencies obtained) are read back through an ADC. Some calculations on the result reveal how much of the signal is attenuated and its phase, resulting in a Bode plot. The filtering is done through digital signal processing from a microcontroller.
While the signals initially ran through a physical RC-filter, testing the Bode plotter with different circuits made running the signals through a digital filter easier, since it eliminates the need to solder resistors and capacitors onto protoboards. Plotting is done using Python’s matplotlib, with the magnitude and phase of the output determined analytically.
It’s a cool project that highlights some of the capabilities of microcontrollers as a substitute for a pricier vector network analyzer.


https://hackaday.io/project/6490-a-versatile-labtool/log/22532-a-few-basic-electronics-experiments-with-guis
Self plug : using a PIC processor and some opamps .
Gotta explore the use of a digital filter. Sounds fun
The approach used severely limits the maximum frequency, as it does not take into account the delays introduced by the DAC and other things. You can actually see this in the graphs he produced: he measured a simple first-order RC filter to have more than 90 degrees of phase shift at higher frequencies.
I’d very like to see a simple, cheap vector network analyzer for frequencies up to tens of MHz. The only device I know about which can do it is the Analog Discovery 2.
NanoVNA can be had for around 40eur shipped.
100kHz-300MHz with better than 70dB dynamic range and reduced performance on the upper bands from 300-600MHz and 600-900MHz.
It’s a portable standalone instrument that can also be connected to a computer for rich plotting options.
It is also opensource.
Thanks! I’ll check it out.
The N2PK VNA is a very capable instrument up to ~50MHz. It has a very high dynamic range.
“The input to the analyzer is a series of sine wave signals with linearly increasing frequency” isn’t this the output to a network to be analyzed? Meaning the test signal that comes from the DAC?
The 12 bit ADCs on the chip can go 2 MHz and work in pairs for quadrature sampling. An impulse response done with an FFT will be very fast and perhaps nearly real-time. It produces phase and magnitude (the vector) and resolution can be zoomed by varying sampling, and scale factors in the FFT. Just sayin – next generation?
You mean ‘electronic engineers’ electrical engineers typically don’t need bode plots since their wiring is typically fixed frequence (50 or 60Hz)
I don’t know how the people around you use the term electrical engineer, but I have always seen electrical engineer being used as a blanket term. An electrical engineer could describe a variety of specialties, ranging from energy systems to radio or embedded systems.
A lot of people mistakenly use one term for the other.
That would include almost every major university in the US. Most offer degrees in Electrical Engineering, which encompass the above.
You are thinking of Electronicist versus Electrizicist.
Some science fiction writers and futurists of the 1920’s and 30’s pushed out “electronicist” but it did not catch. O well, you say Dimondium I say Dimondinium.
Wow so many bad comments. Great work for a simple MCU and despite the deviation from perfect result you have the basics covered. We’ll done