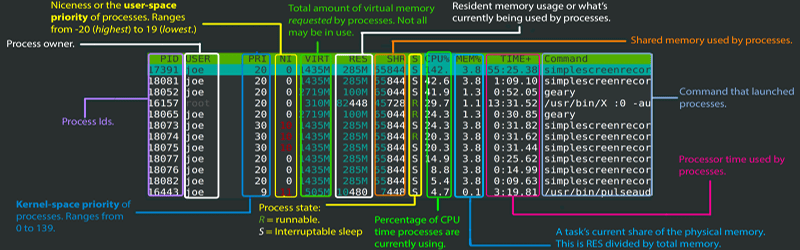
If you want to know exactly what’s going on in your Linux system, some of you might reach for top. For the connoisseur of system monitors, nothing less than htop will do. Not familiar with htop? [Umer Mansoor] did a beautiful job of explaining it graphically.
We’ve mentioned htop in a previous Linux Fu, but we’ve never gotten a chance to dig into it. And now, we don’t have to. Like top, the htop program is still text-based, but it has a much nicer interface with colors, and easier way to send signals to processes, and support for tree displays. You can even use the mouse with it if you want to.
[Umer] did a lot of work to take screenshots of htop at work and annotate them. Sure, you could read the man page, but we think this is a lot better.
Of course, there are other improvements to top. Glances is pretty interesting, for example. For serious system administration help, you can try Webmin or Cockpit.


I still miss the old “System Monitor” terminal window in the corner of the screen.
I hope when I install my next Linux (without systemd), I’ll be able to get one back.
Can you explain what you are referring to ? Screenshot ?
Think there was one on some distros with KDE desktop in 2005ish timeframe. Only vaguely remember it though.
There was a what ?
The system monitor window (or xterm, or term) would constantly update with background processes, instead of showing the “top” resource users, it gave an overview, such as
so and so logged on (locally or remotely)…
But a really nice thing was if disk or other errors were occurring, you’d see them as they happened. (Uh-oh! We’re getting lot of errors with disk2 partition b, we should check into that!)
SunOS had one in the admin or sysop screens, other UNIX machines did too. It was really handy.
It was sort of like “live” dmesg.
But like what did it look like ?
dmesg -w in a terminal may get you close.
journalctl -mf goes beyond the kernel logs, but you’d have to get over your systemd hate first.
It was based on xload and was just a very tiny widget in the upper right corner that showed the system cpu load as a graph. You can still enable in on Ubuntu, I’ve seen it on some work laptops.
The one I’m thinking about was scrolling text, not graphical, but we did use the graphical one sometimes as well. On SunOs, the graphical one showed that running SunOS consumed ~25% of the processes (Sparcstation 1).
On FreeBSD here, but I start xconsole before the slim login manager and before my window manager. Although I think all it is doing is reporting what dmesg reports. But it sounds similar to what your describing, which I presume is what you would see on on the console when xorg is not running, just in a window.
I also remember and miss it. I end up simulating it with a terminal running tail -f /var/log/kern.log, but it isn´t the same thing.
We had it in HPUX, Solaris and I think but not sure in the stations connected to an IBM AIX system…
There’s a really nice combined graphics and text monitor called gkrellm. Configurable, it can include CPU speeds and loads, top processes, temperatures, voltages, fan speeds, disk and internet activity, memory and swap space, date, time, and up time.
Hmmmm!
Interesting!
Danke!
I think you talking about either gkrellm or conky. They are really useful indeed
Are you thinking of xconsole? You still get it on a default graphical openbsd install. The program exists in Ubuntu but I don’t think there is a console device configured.
I install htop on each and every linux machine I have to connect to (and vim obviously), but sometimes, glances (https://nicolargo.github.io/glances/) might provide some more interesting details. htop cousins like iftop, iotop and powertop may be useful as well
nmon is worth a look too :)
I also install on every machine I have. Not shown above is the header which shows all the threads the CPU has and their current usage, plus other extra info. I usually just have it up in the right corner of my monitor to glance at.
I do not use software (especially no admin tools) that suggests: “curl https://foobar.example.com | bash”.
That’s outstanding! Thanks for the link. Also, looks like we’ve given him the Hackaday Hug of Death.
You can say “ncurses-based” instead of “text-based,” if you’d like. With that said, one overlooked feature of htop is mouse interaction. Even when using PuTTY, you can click and select and toggle things using a mouse. Not an expected feature, but when in a GUI, it’s an added layer of convenience.
Okay, sold, you answered the why the flip should I use it question, vs any regular version of top
I use htop. But I still prefer top. It gives me more stats at a glance than htop does. Htop is definitely nice to see which CPUs are busy. But all those pretty graphs can soak up a lot of space when dealing with 12, 24 or more cores, especially if you throw in hyperthreading, which doubles the number of cores being shown. I’ll have to check out this “glances” I hadn’t heard of that one yet.
I use htop and glances depending on mood.
Also use ncdu ( shows disk usage, allows nice tricks like showing number of files all the way down instead of disk usage, very convenience when cleaning up old massive file trees so they are quicker to backup )
My coworkers all use htop. And when I ask important system performance questions they are unable to answer because htop doesn’t display them. It’s a toy application as far as I’m concerned. If you can’t see io wait or what channel/queue a task is in, you’ll have a heck of a time trying to figure out why drivers or hardware is misbehaving. You’ll keep thinking your system is slow even though the cpu usage appears low (when you should be looking at load average to determine if a system is idle or not)
The combined features of htop make this tool perfect for troubleshooting. It replaces many steps. The article scratches only on the surface. You have top on steroids where you can SEARCH inside and SCROLL through verv, very long commands which top cannot display properly. You can NICE and KILL processes directly, without leaving htop. You can display TREE, no need to exit htop for this. htop is in maybe 80% of all cases the first and only command i need to identify a problem.
Hi. The images you’ve used were created by me and not the author you’ve mentioned in your post (he just copied it from my blog). Here’s the blog post I published a few years ago. https://codeahoy.com/2017/01/20/hhtop-explained-visually/
Would appreciate it you update the source and fix the credit.
Sorry about that, changes made.
Thanks
Am I being silly for liking Windows Task Manager more? I would like to see which processes hug too much the CPU, or the network, or the disk, combined with a nice responsive interface. Responsive = can be resized. Under *nix I have to resort to htop + iotop + various widgets, neither of them does a full job.
The task manager is also not perfect, I would like to have the data from Resource Monitor at a glance: e.g. which files are being written to/read from right now from which processes.
My perfect monitor: works in text or graphics mode, can show or hide CPU, network, GPU, I/O bandwidth (including USB). The most intensive processes are shown including which files they access and/or network connections. The ability to force stuff to run single-threaded so that the CPU boost functionality is better used.
Mac’s Activity Monitor is also quit a bit nicer than the usual *nix tools, right up there with Windows Task Manager in my opinion. And remember most Linux desktop environments (GNOME, LXDE, etc) come with some reasonable clone of Task Manager.
I use gkrellm on my Linux box for my GUI needs, it’s a widget that graphs a bunch of stuff like network traffic, hard drive I/O, cpu, memory. But doesn’t let me dig in and kill stuff, and is a less powerful tool. It’s a lot like Conky in terms of the niche it fills.
And finally I would recommend Stacer if you can accept a GUI-only solution.
I also found out from gkrellm from this post, I like it a lot more than the gnome system monitor that comes with CentOS.
That is a graphic is very insightful!