Chasing A Raspberry Pi Bottleneck

The Raspberry Pi has been used for many things over its lifetime, and we’re guessing that many of you will have one in perhaps its most common configuration, as a small server. [Thibault] has a Pi 4 in this role, and it’s used to back up the data from his VPS in a data centre. The Pi 4 may be small and relatively affordable, but it’s no slouch in computing terms, so he was extremely surprised to see it showing a transfer speed in bytes per second rather than kilobytes or megabytes. What was up? He set out to find the bottleneck.

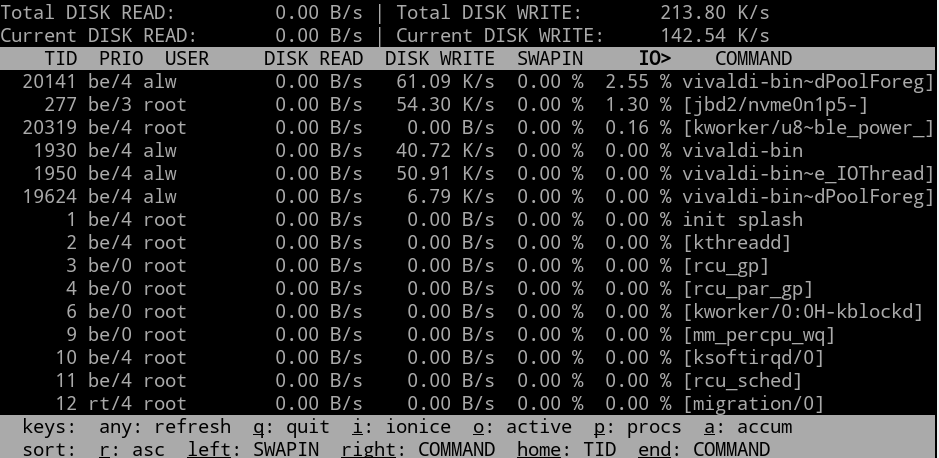
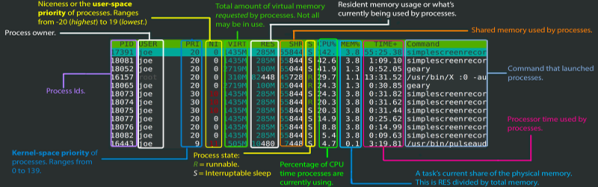
We’re treated to a methodical step-through of all the constituent parts of the infrastructure between the data centre and the disk, and all of them show the speeds expected. Eventually, the focus shifts to the encryption he’s using, both on the USB disk connected to the Pi and within the backup program he’s using. As it turns out, while the Pi is good at many things, encryption is not its strong point. Some work with htop shows the cores maxed out as it tries to work with encrypted data, and he’s found the bottleneck.

To show just how useful a Pi server can be without the encryption, we’re using an early model to crunch a massive language corpus.

Header image: macrophile, CC BY 2.0.

Linux Fu: Monitor Disks

If you want a quick view of a Linux system’s process load, you can use top or — slightly nicer — htop. But what if you want a quick snapshot of how the disk system is doing? There are a few tools you can use, some of which are not nearly as common as top.

First, iotop

Most similar to top is iotop. This program shows you the total and current disk read and write numbers for the file system and also shows you who is eating up the most disk I/O.  This screen looks busy:

Continue reading “Linux Fu: Monitor Disks”

Understand Linux Htop Visually

If you want to know exactly what’s going on in your Linux system, some of you might reach for top. For the connoisseur of system monitors, nothing less than htop will do. Not familiar with htop? [Umer Mansoor] did a beautiful job of explaining it graphically.

We’ve mentioned htop in a previous Linux Fu, but we’ve never gotten a chance to dig into it. And now, we don’t have to.  Like top, the htop program is still text-based, but it has a much nicer interface with colors, and easier way to send signals to processes, and support for tree displays. You can even use the mouse with it if you want to.

[Umer] did a lot of work to take screenshots of htop at work and annotate them. Sure, you could read the man page, but we think this is a lot better.

Of course, there are other improvements to top. Glances is pretty interesting, for example. For serious system administration help, you can try Webmin or Cockpit.