
If you want a quick view of a Linux system’s process load, you can use top or — slightly nicer — htop. But what if you want a quick snapshot of how the disk system is doing? There are a few tools you can use, some of which are not nearly as common as top.
First, iotop
Most similar to top is iotop. This program shows you the total and current disk read and write numbers for the file system and also shows you who is eating up the most disk I/O. This screen looks busy:
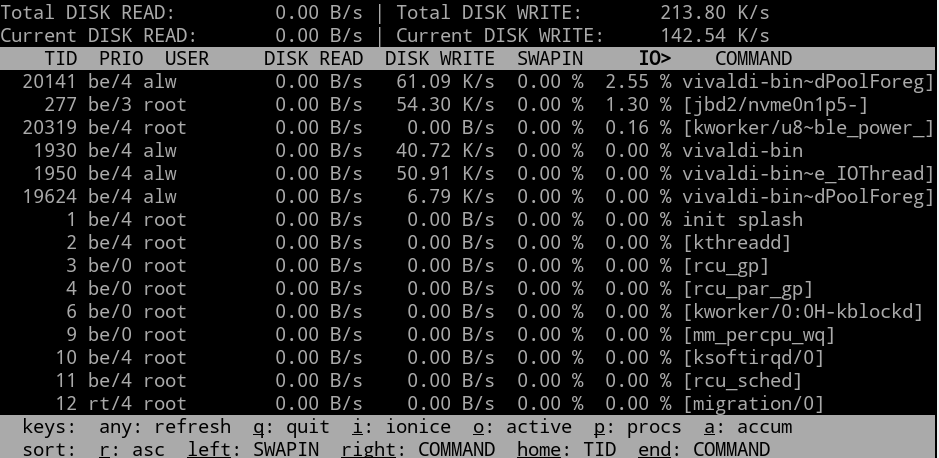
Here’s a tip. If you look at the bottom of the screen there are some key commands. The O key will hide all inactive processes (or show them if they were hidden). That makes the output manageable:
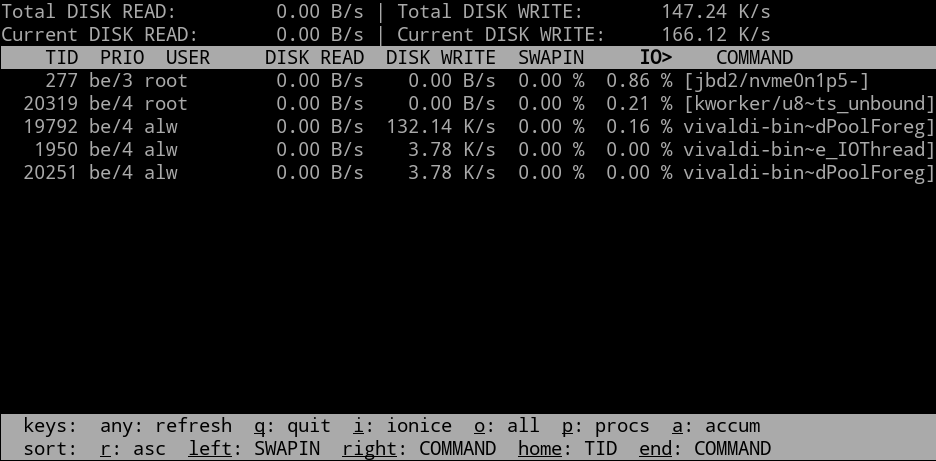
You can get the same effect with the -o command line option. Note the other keyboard commands let you select threads instead of processes, change display options, and set the ionice priority for a process.
There’s iostat
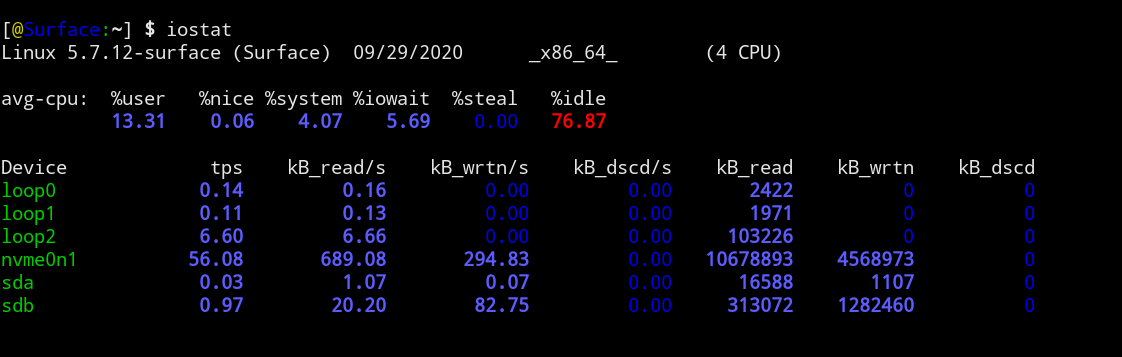
If you are more interested in this kind of data per device instead of per process or thread, try iostat. It shows some process information, too but it is all nicely summarized:
This command just runs one time and gives you a result. If you want to repeat it periodically, you can add a time to wait between reports and an optional count of how many times to execute. If you do that, you might want to add the -t option to get a timestamp, too.
iostat -t 5
That causes the output to scroll, though, so if you are monitoring, you might prefer:
watch -n 5 iostat
There are more stats available with the -x flag and the -z flag will suppress devices that have no data.
Meet duf
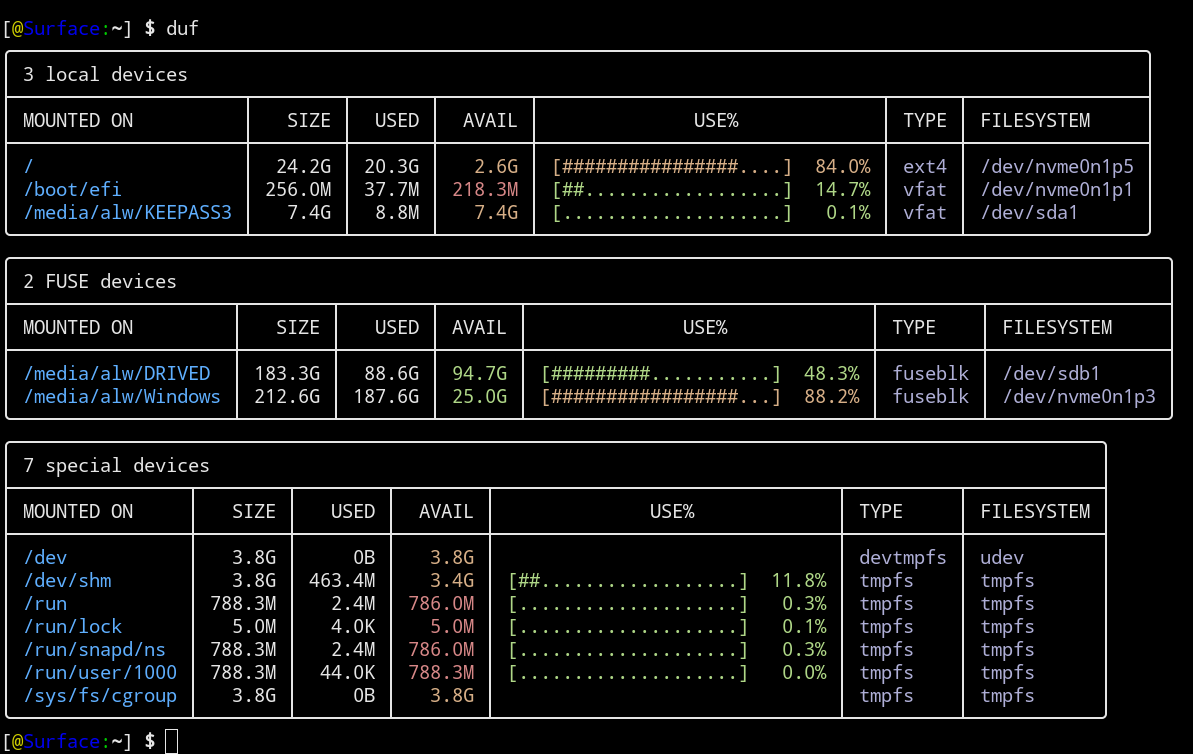
You probably won’t find duf on your system, but you can install it from GitHub. It is true that you can get the same results from df and a few other commands, but duf creates easy-to-read output:
There are command line options to hide devices, control the output width, and sort data differently. You can also set the maximum output width. Use the --help option to learn more.
List Open Files with lsof
If you ever want to know what files are open, that’s the job of lsof. The command gives a lot of information and you typically have a lot of open files on a running system, so you’ll usually add a file name or combine this with a grep to narrow things down.
Just remember that wildcards don’t work here. So the following command only shows you who has the directory /home/alw open. It does not show processes that have anything inside of /home/alw open:
lsof /home/alw
You can change that behavior, though, with the -d or -D options. The lowercase variant looks for the directory and files in the top level. The -D option does full-blown recursion. There are plenty of other options, too, if you want to look by user ID, command name, and more.
Bonus Round: atop
Another replacement for top is atop. While not strictly a disk monitoring tool, it does show disk usage per process and some overall stats. When the program usually starts, it shows some summary information at the top, including DSK which gives disk information. Those lines, by the way, will turn color as they get closer to 100% utilization. The lines at the bottom are similar to what you’d see from top.
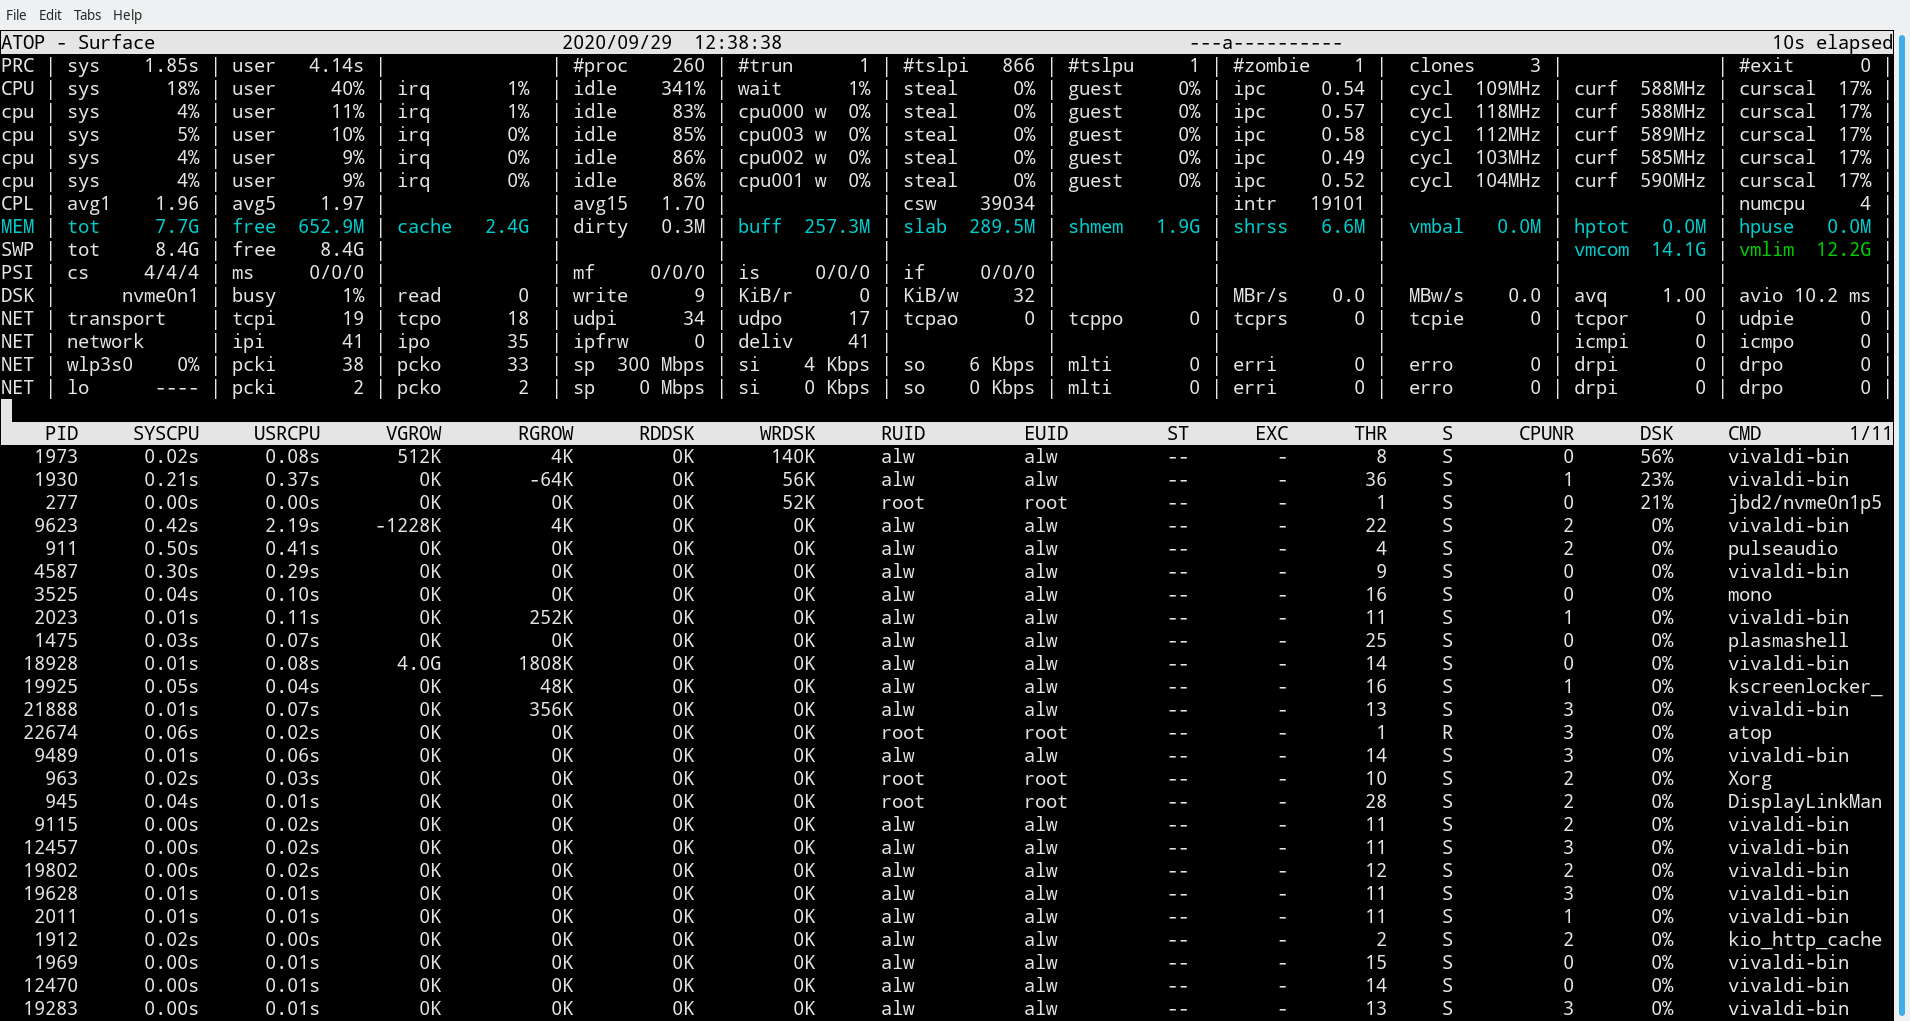
You can use the d command to display a disk view. In any view, D will sort by disk usage. A useful tool.
Like Anything on Linux…
Like anything else in Linux, there are dozens of other ways to get this kind of information. We’ve looked at some dedicated monitoring and administration tools before. If you want to learn more about the fields in htop (which are usually common to top or atop), there’s a great visual guide.


dstat is the swiss army knife of io/vm/etc stat tools…
http://dag.wiee.rs/home-made/dstat/
Dstat was recently taken over by redhat devs as noted by the original dstat dev in his github page.
This linux fu series is seriously handy
pydf (in python, obviously) is a nice df, available in all good groceries..
glances is configurable via glances.conf to show network activity, disk io, filesystem usage/capacity, cpu, memory, swap, temperature, processes, etc etc
#: pip3 install glances
Article missed: glances
You might want to take a look at https://github.com/dankamongmen/growlight