Not everyone is a fan of GUI interfaces. But some tasks really lend themselves to something over a bare command line. Very few people enjoy old command line text editors like edlin or ed. Debugging is another task where showing source files and variables at all times makes sense. Of course, you don’t absolutely have to have a GUI per se. You can also use a Text User Interface (TUI). In fact, you can build gdb — the GNU Debugger — with a built-in TUI mode. Try adding –tui to your gdb command line and see what happens. There are also many GUI frontends for gdb, but [cyrus-and] has an easy way to get a very useful TUI-like interface to gdb that doesn’t require rebuilding gdb or even hacking its internals in any way.
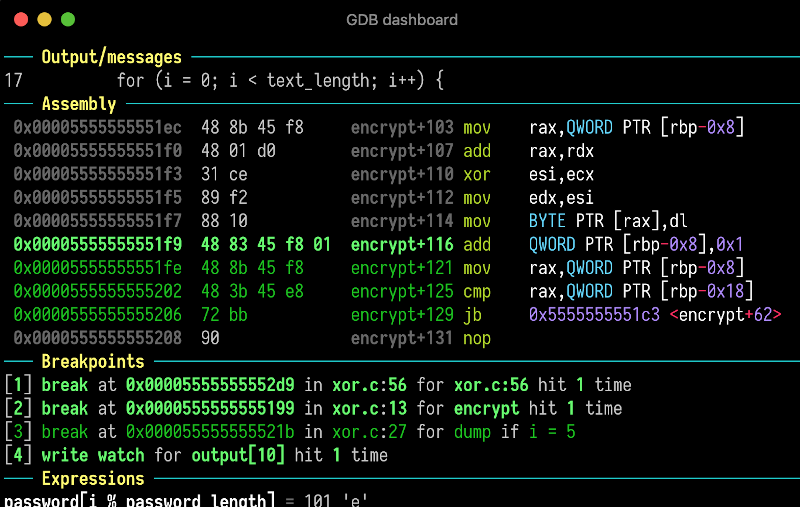
The secret? The gdb program runs a .gdbinit file on startup. By using Python and some gdb commands, [cyrus-and] causes the debugger to have a nice dashboard interface for your debugging sessions. If you install a helper script, you can even get syntax highlighting.
The system uses modules and you can even add your own custom modules and commands, if you like. You can also control what modules appear on each dashboard display. Normally, the dashboard shows when the program stops. For example, on each breakpoint. However, gdb has a hook system that allows you to trigger a dashboard using the appropriately-named dashboard command on other commands, too. Using the layout option to the dashboard command, you can even trigger different modules at different times.
Installation is simple. Just put the .gdbinit file in your home directory. If you want syntax highlights, you need to install Pygments, too. We understand you can even use his under Windows, if you like.
We don’t always take full advantage, but gdb is actually amazing. The flexible architecture makes all sorts of interesting things possible.


just install Eclipse
How about no?
GDB with or without tui is a totally different beast to Eclipse, and for those who like it it’s a much “lighter weight” and faster experience than the bloated behemoth that is Eclipse.
I think what they meant was “just use an IDE”. If you use something with GDB integration (like CLion) it’s actually quite nice. You get your GUI for point-and-click breakpoints and stack navigation, and then you also have the GDB command line if you need to go deeper.
At my university, they made the mistake of teaching debugging (and git, for that matter) using only the CLI and then never requiring it again (Keep in mind – these are beginning CS students who barely know how to use a command line in the first place). Most students ended up never using a debugger again, and suffering ever more for it later.
Aehem…no!
The command-line interface of GDB has between 10 or 100times more commands than you can use
in eclipse. In case of some serious problem use it! Eclipse is only okay for the normal every day problem that
are easy to find.
The important question in this case is, Why use phyton? Any serios programmer who is using gdb
on a serious level did program in C, So it should the first idea to write the fancy interface in C, too.
Olaf
i was tasked with writing a plugin for eclipse and it showed me a whole new bad way to write software. i guess i’m grateful, it really opened my eyes to “how the other half lives.”
it. is. so. bloated.
and. fragile.
and. opaque.
i’ve never seen anything as bad, even in stuff that uses the same awful approach, it is a pinnacle unto itself.
I was there when Freescale ditched CodeWarrior and made it Eclipse-based – the old version was small and tight and felt like a really efficient piece of software honed over decades, the new one was like piloting a drunk hippo.
I really don’t get why the whole freakin’ world is now Eclipse-based, for most of the IDE’s it’s just removed pretty much any differentiation between your products whatsoever, and Eclipse is just the most bloated and opaque thing.
I still daren’t install more than 1 Eclipse-based IDE on the same machine as I fear the hideous results of one IDE over-writing the other’s settings or something.
GDB is esoteric and difficult to use and the manual is concise but dense. But there are actual in-person paid classed available for learning Eclipse. Hmmmm.
no, no, no ! (how i stopped being a masochist and learned to love VScodium and PlatformIO)
eclipse is a crusty dry-rotted pile of crap. It’s ancient and finds its only relevancy in developing legacy frameworks that were “new” 25+ years ago.
Any lessor words to describe eclipse other than “crap” would be inadequate in conveying how poorly designed and maintained it is. I would rather use vim for the next 20 years over eclipse for the next 6 months.
IDEs do not need to have every single “bell and whistle” for every single niche application of it. A good IDE should be extensible for the user to develop their own toolbox. A good IDE should provide options, not dictate standards on how to code. A good IDE should not constantly crash due to the litany of plugins installed by “supported” packages.
All this goes for VSCode as well, so don’t feel I’m singling out eclipse. VSCode is newer, but jaysus christopher, get your shit together Microsoft and start applying QOS rules against the plugins index. It’s almost as bad as npm these days.
I will have the program finished in a regular text editor by the time Eclipse is done opening.
I usually run gdb using cgdb, to get a very simple TUI with the GDB console, source file viewing, easy breakpoint setting, etc. using vim-like keyboard bindings. But this looks interesting, I have to give it a try!
Turbo Pascal did it better and fits in one diskette…
I used to have Turbo Debugger running on a second monochrome display. It made it rather convenient to reverse engineer, add things to my favorite games, fix annoying copy protection so I could safely store my original disks away, etc.
I still have my school 5/4(bbc) to college 3 and half inch (pc) turbo pascal stuff, aah such memories. ooh and when i found out i can do ports to sound cards, vga dma writes I dreamed of porting blitter chip code. sigh.
“Not everyone is a fan of GUI interfaces.” that’s me!
the thing about a GUI is you have some idea like “showing source files and variables at all times makes sense.” and it’s true, it really does! there’s never a time i don’t want to see *all* of the source and *all* of the variables. the thing is, that’s not possible! even with a GUI, that’s not possible. most of the time i don’t want to see much of the source (a single line suffices), but sometimes i need to scroll or search through rather a lot of it. most of the time i’m only curious about one variable, *but which one*? about 50% of the time i’ll *never* look at the assembly but the other 50% of the time it’s my primary interest and i want to be able to view a lot of it.
so i haven’t used this one but generally debugging GUIs and TUIs make you click or arrow-key through a bunch of stuff to find the thing you actually want. instead of “print x”, you’re scrolling through a list looking for the x. if you’re lucky maybe you’ve got some sort options for the list? iow, more things you need to do that get in the way of “print x”. it is so often that i want “print x->member” in a huge struct where preemptively showing me all of the members will just make it unwieldy!
inspection: x display print list. command: step stepi next nexti continue finish break watch. it’s not perfect but it lets you do what you want to do with a minimum of uncertainty. the least productive activity for me is scrolling through a list…instead of looking at the thing you want, you are looking at a bunch of stuff you don’t want, purely navigationally. lag isn’t an everyday part of my life but it’s illustrative that you can’t scroll through lag…you are doing a human input task (looking) merely as part of a human output task (commanding). i want to save my looking for when there’s something new i want to see, because *there is so much i want to see*.
this is bascially the GUI problem in a nutshell…if you don’t know what to do then it is kind of inviting but if you do know what to do then it just gets in the way. but if a GUI was there while you were on the learning curve, then you can be stuck still using the GUI long after you grew out of it.
in debugging, it’s actually the same as the bad comment problem. it’s not that i don’t want to know how the code works, it’s that i really really need to know how the code works and wasting screen real estate on low-quality information is a crime.
it’s a really hard problem to solve well and, having used a *lot* of debuggers over the years, there is nothing so good as simplicity, imo.
voltron is also super flexible and super nice.
pwngdb is alos good you can also combine the two. You can also combine the these with ghidra. This is quite helpful if you don’t own the source, or the source is optimized.
everybody like gui but trouble is gui is slooowly
if anybody can create a faster gui than tui people will be using gui
Did this comment get stuck in some pipeline for the last 20 years? The graphics performance on computers today is just overwhelming.
ironically: no it isn’t.
the hardware is incredibly capable but the performance available to the end user has largely not improved at all. all the individual operations still take wall time. i was astonished in 1995 to find that i could type faster than MS Word 6.0 could display characters. lo, you will still sometimes have this experience today!
there’s no intrinsic reason GUIs should be bloated and TUIs should not be. well, there is one: GUIs are very well-developed while TUIs tend to be hacks abandoned before anyone even starts using them. GUIs have a queer attribute that has been well-preserved for decades: the more thought you throw at it, the slower it gets.
your core assumptions make sense — i’ve made many GUIs (one-off private hacks) that are very very fast on modern hardware — but in the ‘real world’ that’s never how it’s done.
“Try adding –tui to your gdb command line and see what happens” , i have for years and many tears but alas nothing, in the end i always failed over to openocd and something easy at the time to trace and fix the issue. I wanted the debug interface to be someone else’s design problem and i’ll have a few tools in the box. I’am talking with repair in mind not design or manufacture.