
When viewed from just the right position in space, you’d be hard-pressed to think that our home planet is anything but a water world. And in all the ways that count, you’d be right; there’s almost nothing that goes on on dry land that isn’t influenced by the oceans. No matter how far you are away from an ocean, what’s going on there really matters.
But how do we know what’s going on out there? The oceans are trackless voids, after all, and are deeply inhospitable to land mammals such as us. They also have a well-deserved reputation for eating anything that ventures into them at the wrong time and without the proper degree of seafarer’s luck, and they also tend to be places where the resources that run our modern technological society are in short supply.
Gathering data about the oceans is neither cheap nor easy, but it’s critically important to everything from predicting what the weather will be next week to understanding the big picture of what’s going on with the climate. And that requires a fleet of data buoys, outnumbering the largest of the world’s navies and operating around the clock, keeping track of wind, weather, and currents for us.
Data Buoy History
Considering how important ocean data is, we’ve only been able to make direct measurements of what’s going on out there for a shockingly short time. Apart from observations from ships at sea, which go back to the beginnings of marine wireless transmissions, the US has only been deploying dedicated data buoys since the 1940s. Early buoys were equipped with battery-powered instruments that only made the crudest of measurements, and were often controlled by clockwork-driven mechanisms that made frequent servicing visits necessary. Data was usually transmitted over HF radio links using Morse code, so reports were subject to the vagaries of ionospheric conditions and had to be collated manually.
The 1950s and 1960s saw rapid improvements in electronics, and buoys began to be outfitted with more and better sensors. In addition, improvements in battery technology and eventually solar power decreased the need for frequent service calls, making it possible to deploy buoys further out to sea. Improvements in materials, especially polymers, made stronger moorings possible as well, which allowed buoy deployments in deeper and deeper water and opened up vast amounts of the Earth’s surface to direct monitoring. The development of satellite technology was also an important step, not only for their ability to reliably gather data from buoys far offshore, but for the images and remote sensing they were able to perform, providing valuable context for the data coming back from buoys.
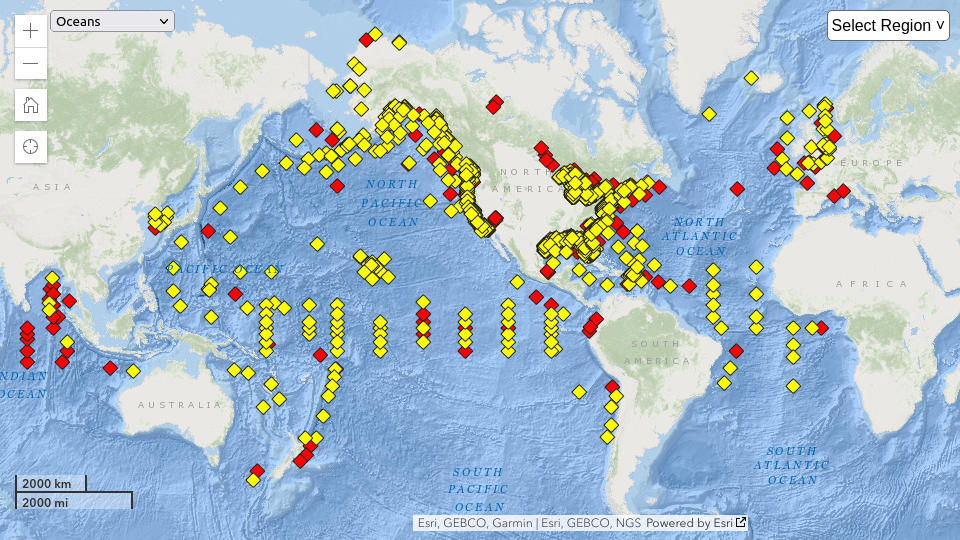
Perhaps even more important than technological improvements in weather buoys was the development of the systems needed to gather and analyze their data, as well as building organizations to coordinate the entire process. The development of computers in the 60s and 70s made the former possible, while the creation of consortiums like the National Data Buoy Center (NDBC) covered the latter. As one might expect, deploying a large number of buoys into some of the deepest waters on the planet and keeping them running is an expensive business, with individual agencies and institutions unable to foot the bill for an entire network. Each institution therefore tends to own and operate a small fleet of buoys, which are part a large network where members all share their data.
Buoy Types
If there’s one description of a standard data buoy, it’s that there’s no such thing as a standard data buoy. It’s not so much that buoys are all bespoke designs; there are only so many ways to build something that will float in one place reliably. It’s more that the specifics of where the buoy will be deployed and what data it will be expected to collect determine what the thing will look like, and what equipment will be loaded aboard.
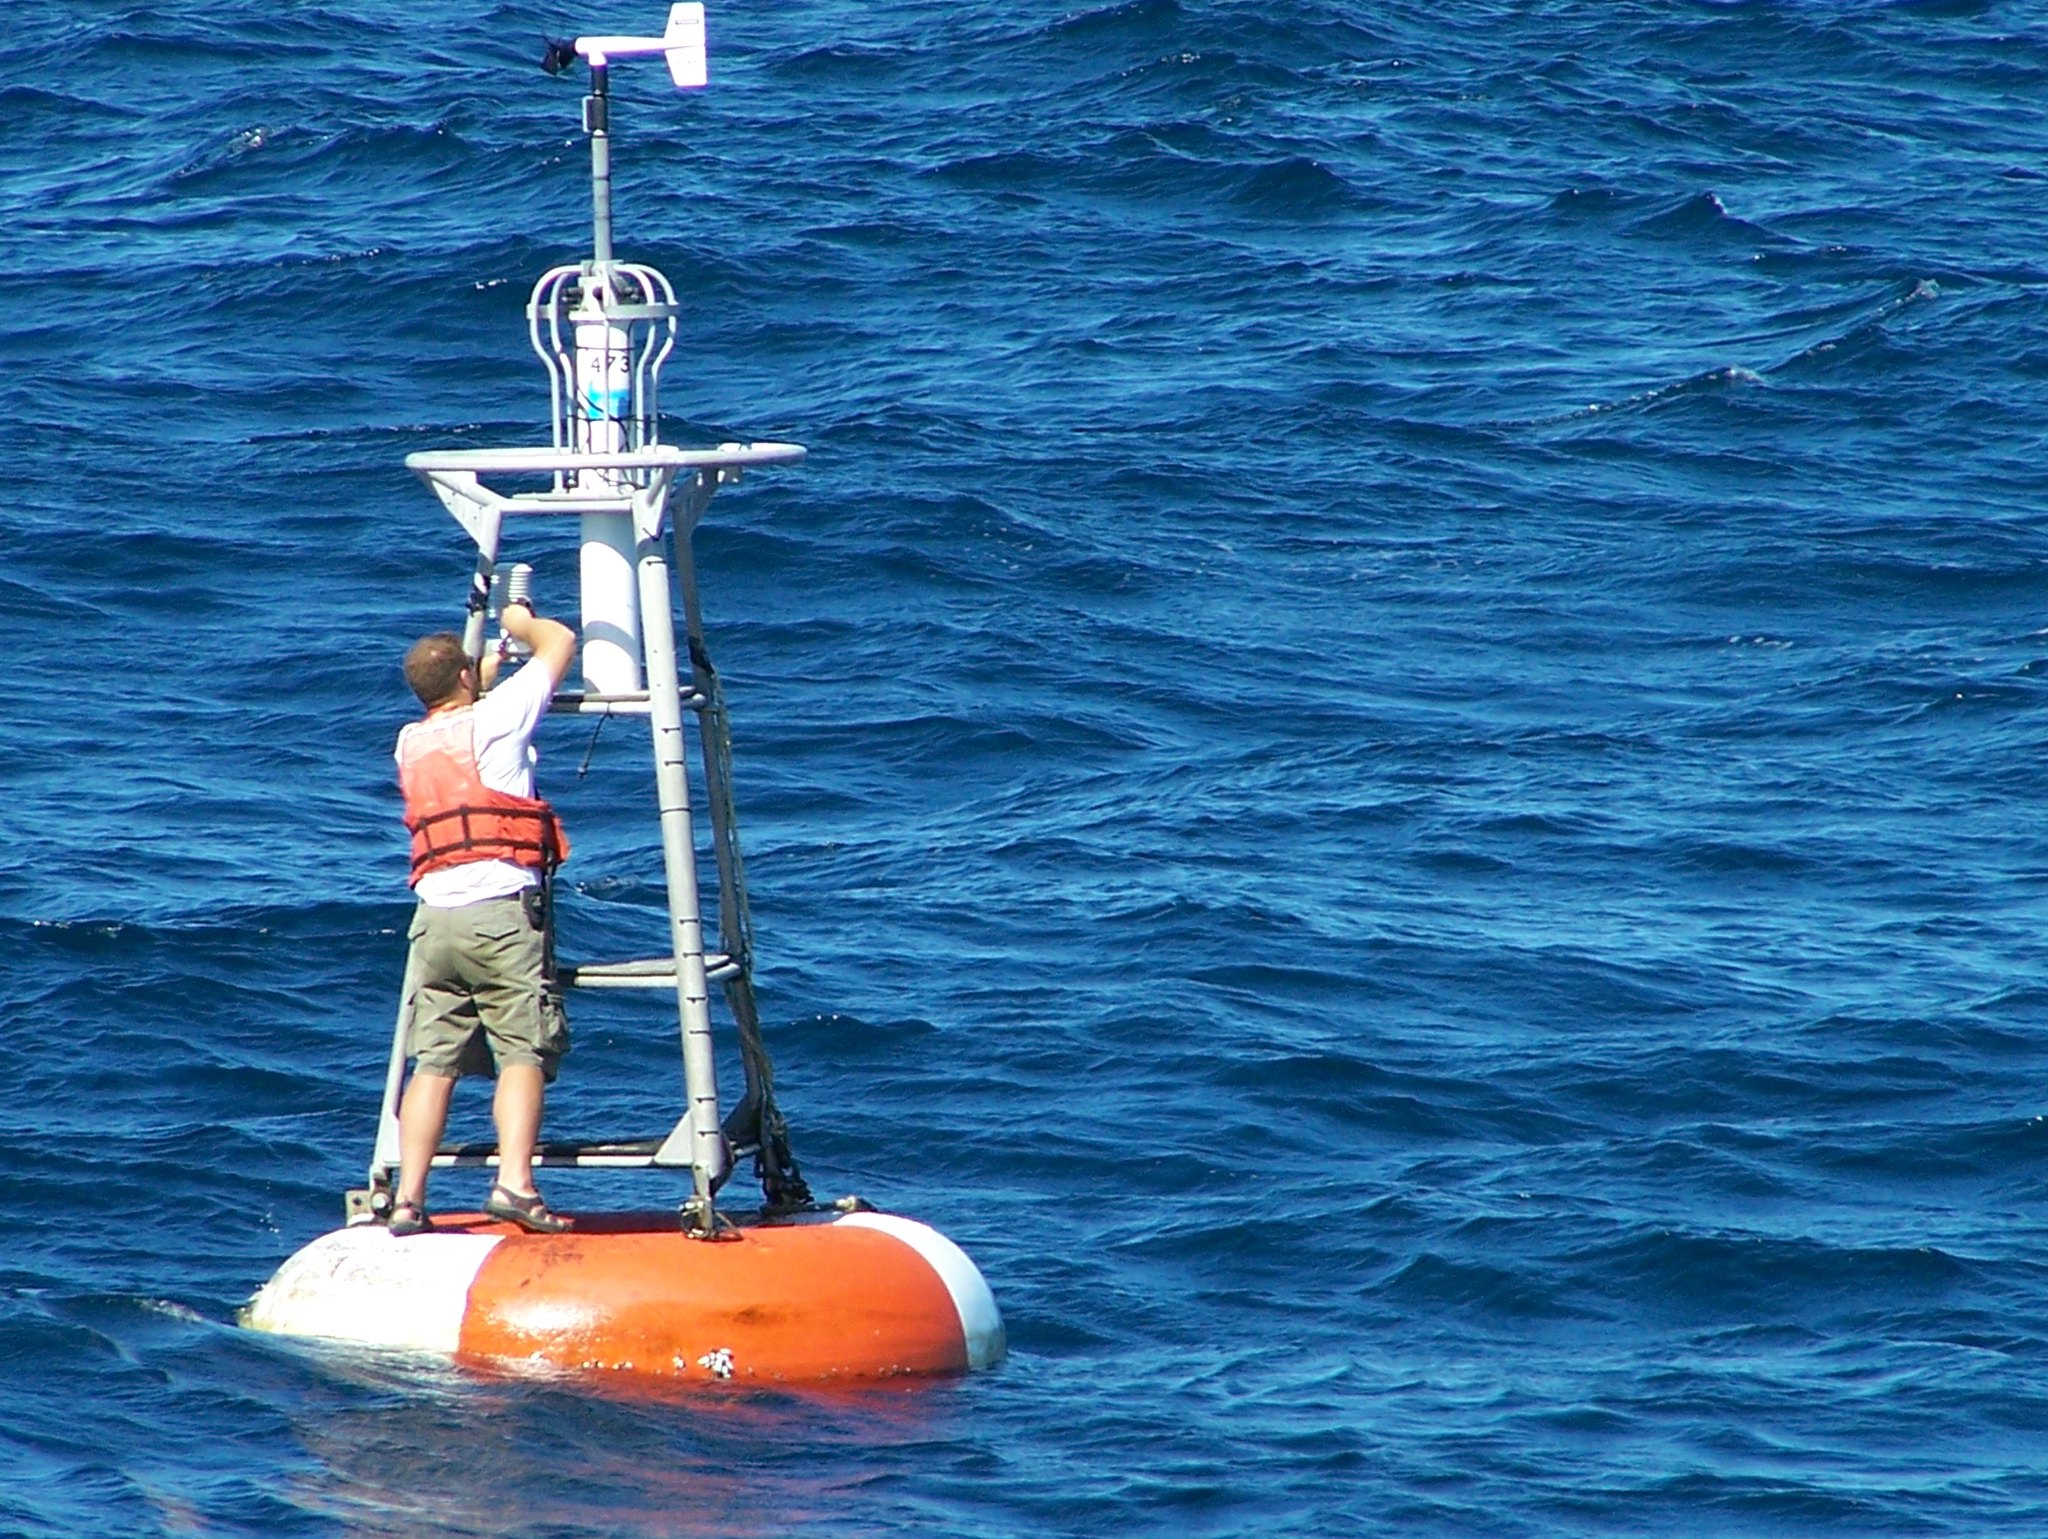
A data buoy is obviously nowhere near as complicated as, say, a container ship or a naval frigate. But there’s still some pretty sophisticated naval architecture that goes into data buoy designs. Early buoys were prone to capsizing, which tends to be bad for the instruments mounted on their superstructures. Getting the right mix of hull shape, ballast location and amount, mooring mounts, and superstructure design is a delicate dance, complicated by the fact that unlike ships, data buoys can’t maneuver out of the way of rough weather; indeed, their main purpose is to ride out a storm and tell us what’s going on.
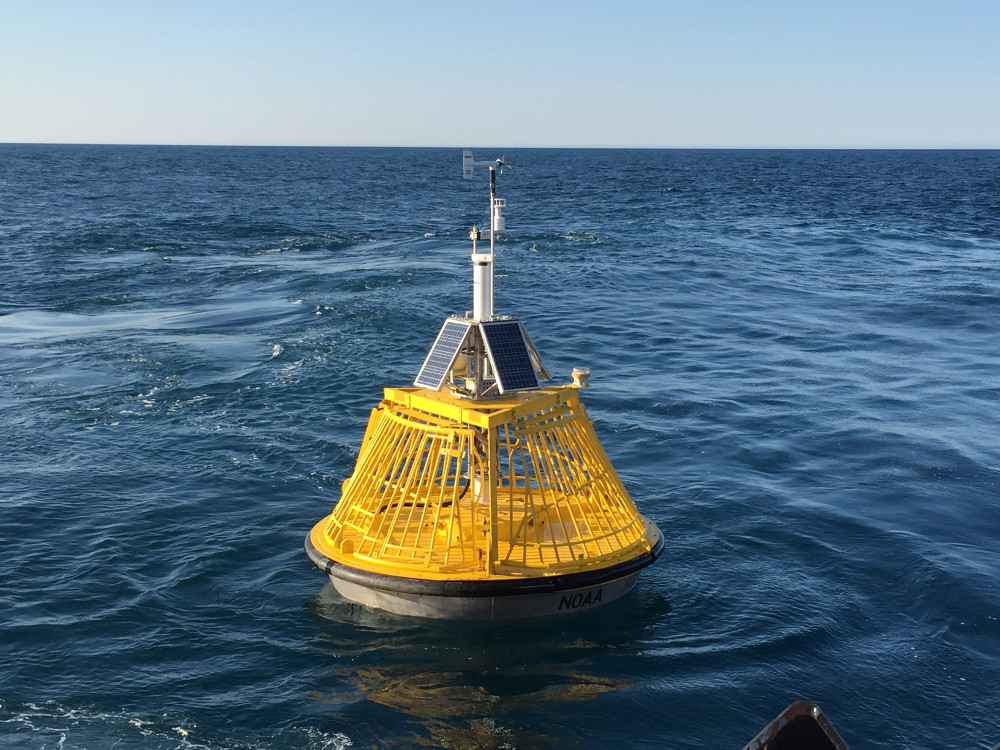
One common design for data buoys is the discus type, with either disc-shaped or toroidal hulls. NDBC buoys range from 3 meters in diameter to a whopping 12 meters. The larger 10- and 12-m buoys are steel-hulled and need to be towed out to their moorings and serviced by larger vessels. Smaller buoys, such as the 3-m discus buoys and the 6-m boat-hulled NOMAD buoys are made from aluminum. Aluminum buoys have some advantages over their steel-hulled cousins; they’re lighter and can therefore be towed and serviced by smaller vessels, and they tend to interfere less with instruments like compasses and magnetometers. They also handle corrosion better, a serious concern in a saltwater environment and in locations where seabird droppings will accumulate. On the other hand, aluminum buoys are not as strong as steel hulls, especially in shipping lanes or where orcas might want to play with floating things.
Moorings
Whatever physical shape the buoy’s hull takes, a lot of marine engineering goes into making sure it’s a stable and reliable platform. Hydrodynamic stability is a must; data buoys are destined for a rough ride and need to stay upright and in place on their moorings. Buoys are typically designed to be “stiff,” which means they will have a short roll period in heavy seas and tend to react very quickly when external forces heel it, or tip it to one side or another. A stiff vessel tends to ride waves better than a “tender” one, and while not comfortable for passengers, works just fine for a data buoy. Overall buoyancy is important, too; the buoy has to have enough reserve buoyance to pop back up to the surface if it somehow manages to become submerged. Enough buoyancy to lift the moorings and anchor off the sea floor is important as well, in case the buoy gets accidentally dragged to deeper water thanks to currents, storms, or snagging on a vessel.
Conditions at the mooring location have to be taken into account too; what works for a quiet spot in the Gulf of Maine probably won’t work for the strings of buoys straddling the equatorial Pacific to monitor El Niño conditions. Although generally called out on maritime navigation charts, data buoys are not intended to be used for navigation, which means they can use looser moorings than buoys strictly intended for navigation, which have a small “watch circle,” or radius of movement. Mooring design also has to take into account any sensors that may need to be strung along the mooring lines, such as water temperature, salinity, or flow of ocean currents.
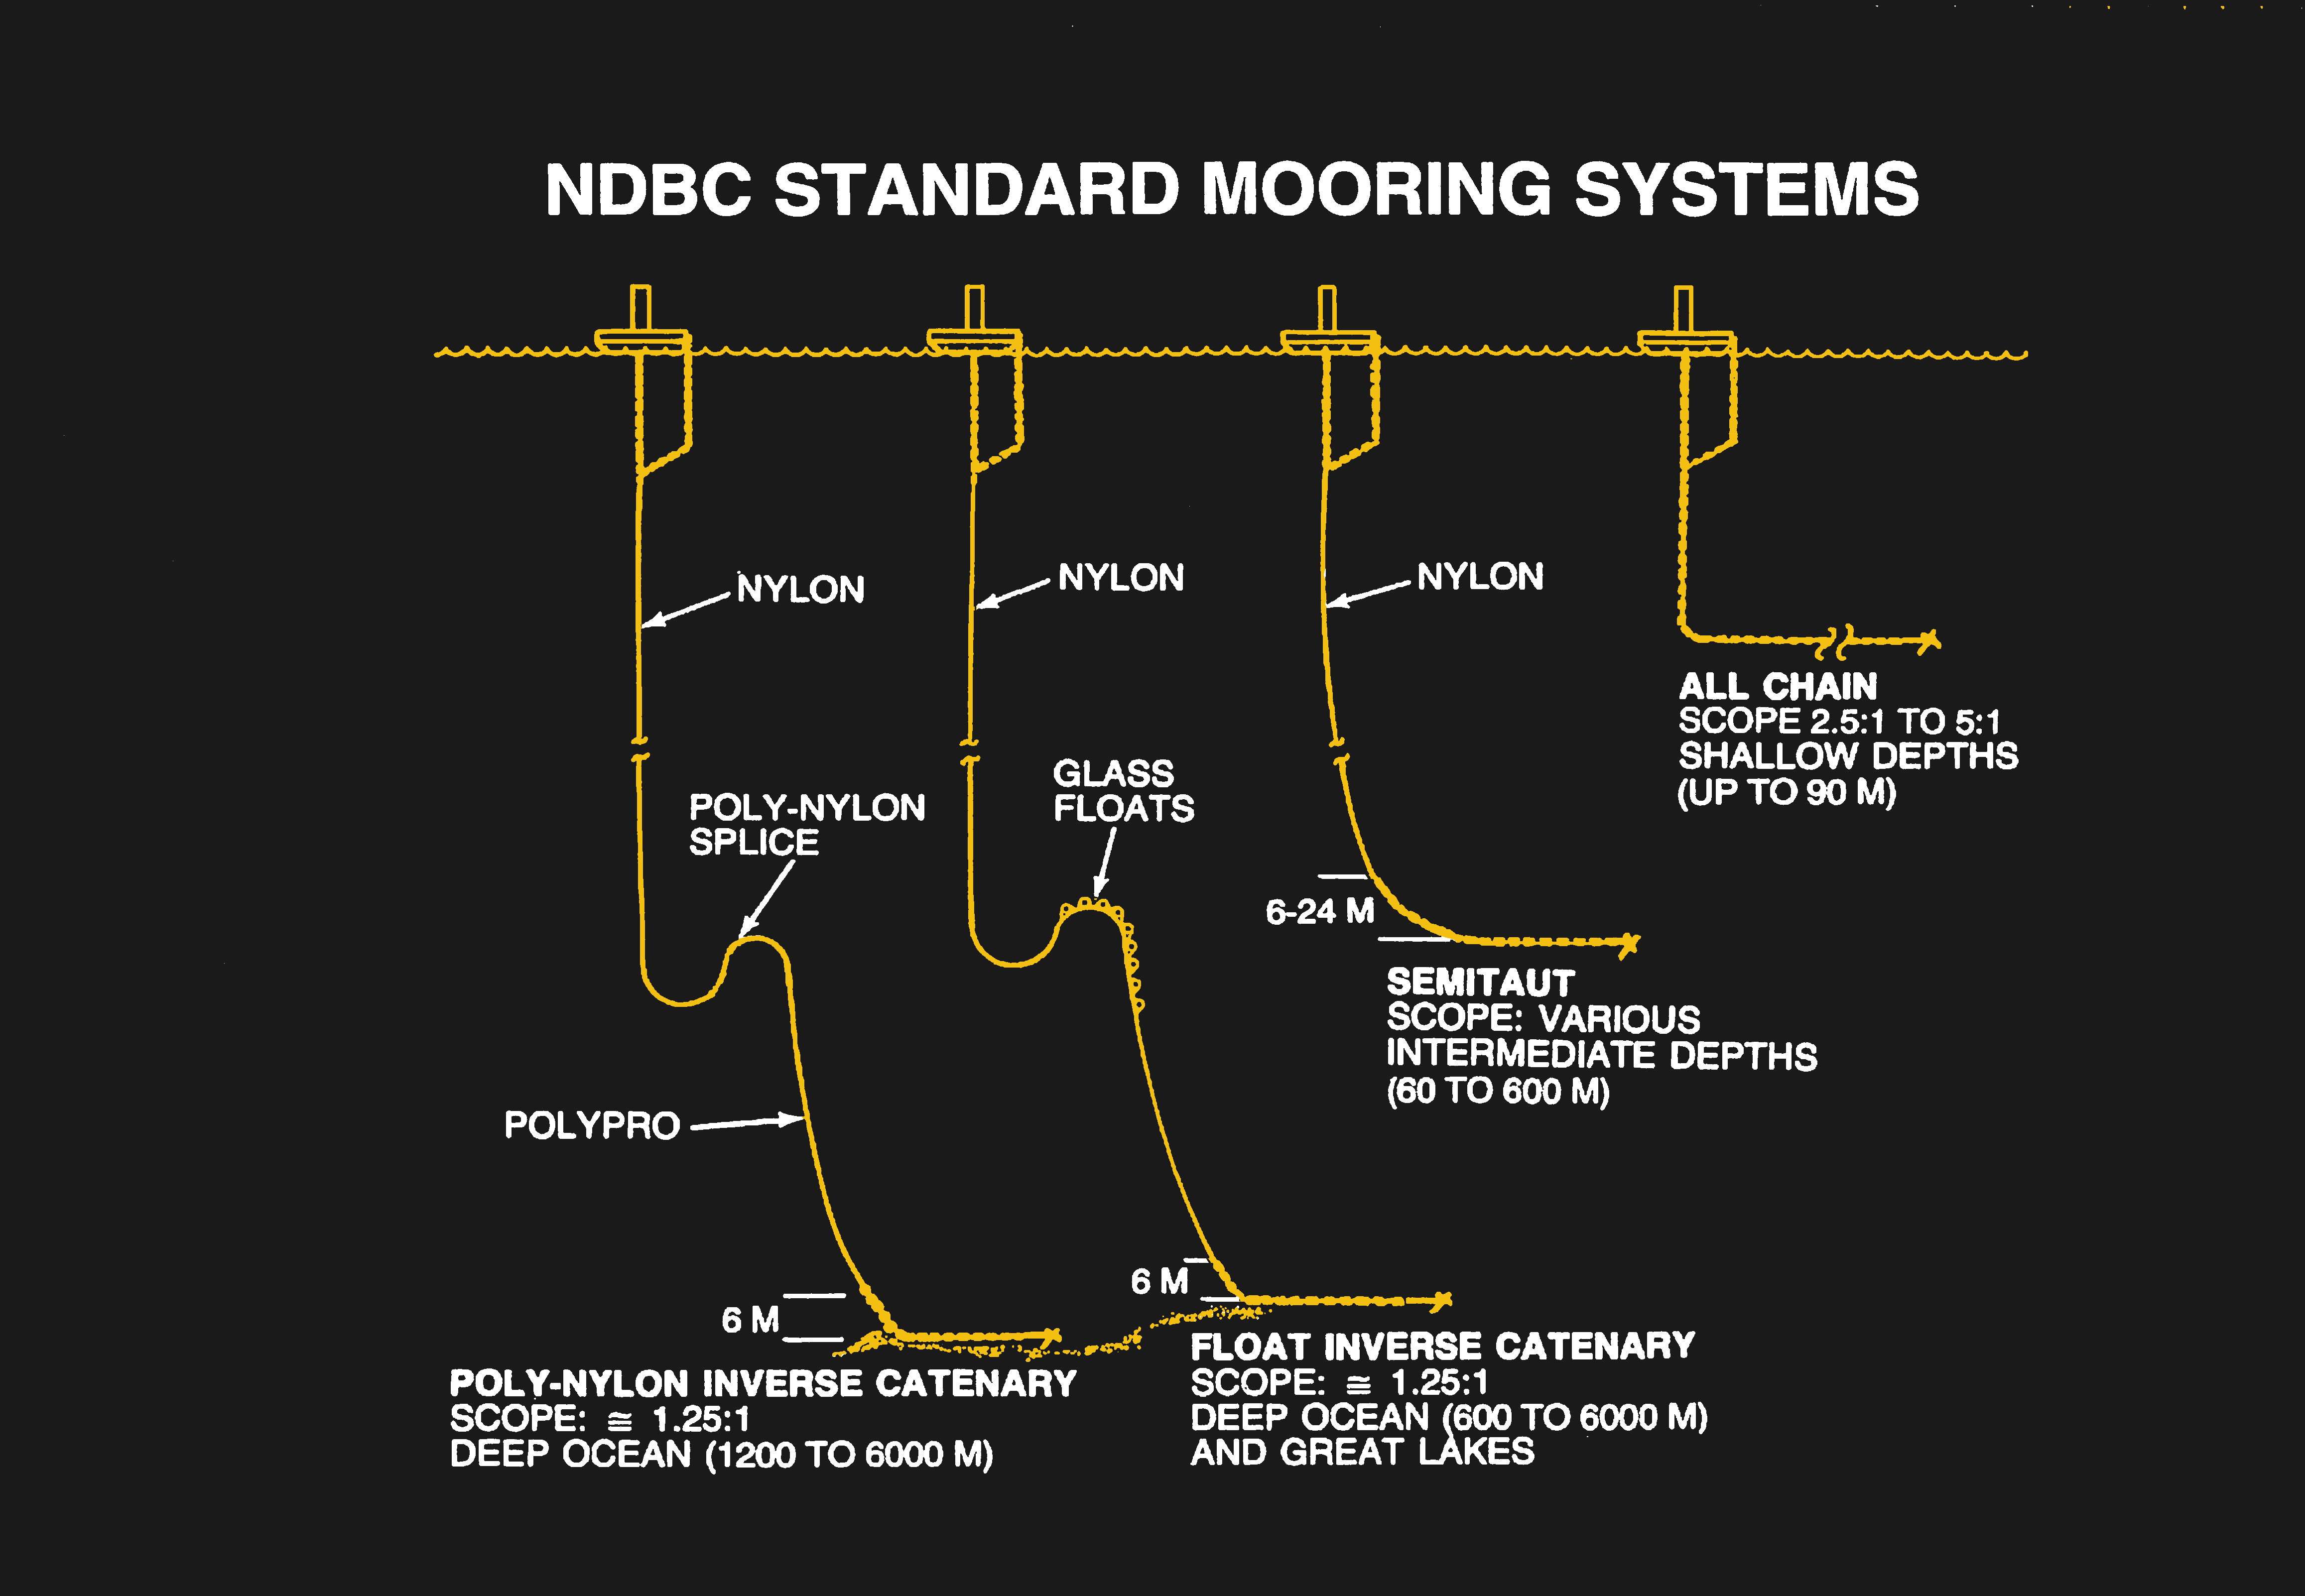
For mooring their data buoys, NDBC uses a combination of chain, nylon, and polypropylene lines. Shallow moorings are all chain, while deeper moorings use chain only at the bottom. The deepest moorings — some deep-ocean buoys are in 6,000 meters of water — use an inverse catenary design, where the lower part of the mooring floats thanks to being made from polypropylene, which is less dense than water, or by attaching floats to the nylon upper mooring line. Floating the middle mooring keeps it off the seabed, which reduces chafing on rocks. All moorings are made fast to a heavy anchor. For rocky bottoms, anchors are usually made from concrete or steel; in the 1940s, decommissioned railcar wheel assemblies were routinely used. For sandy or silty seabeds, more traditional fluke-type anchors can be used.
Instrumentation
The exact suite of instruments deployed on a data buoy depends a lot upon where the buoy is deployed and what parameters are interesting to oceanographers and climatologists. But there’s a basic suite that pretty much every buoy will sport, both above the surface and below. Mounted on the superstructure of the data buoy will almost always be the standard assortment of weather instruments: anemometer, wind vane, thermometer, hygrometer, rain gauge, and barometer, along with the solar panels needed to power the instruments, antennas for data transmission, and aids to navigation like radar reflectors and beacons. The superstructure also usually has a large static vane to keep the buoy pointing into the wind.
Inside a weatherproof well in the hull is where most of the data logging and communications equipment lives, along with the batteries needed to power the buoy when the sun isn’t shining — although some larger buoys with greater power needs will be equipped with generators powered by marine diesel engines. Along with comms and power equipment, the well will usually contain gimballed accelerometers to measure the heave, pitch, and roll of the buoy; these measurements can be used to derive the amplitude and frequency of waves at the mooring. GPS receivers attached to mast-mounted antennas are often included too, to locate and recover buoys that wander from their moorings.
As interesting as things may be above the surface, most data buoy operators are keenly interested in what’s going on in the water, and so buoys practically bristle with sensors. Subsurface temperatures are obviously important, and moorings often contain a dozen or more sensors spaced along the line, to measure temperatures at various depths. Salinity sensors are often included, as are optical sensors to measure the turbidity of the water and measure sunlight penetration.
If ocean currents are to be studied, an acoustic Doppler current profiler (ADCP) will often be attached to the mooring line. An ADCP works by transmitting high-frequency ultrasound (100 kHz or more) down into the water. Suspended particles in the column of seawater will reflect back some of the acoustic energy, with the frequency shifted higher or lower depending on which way the current is moving them. The ADCP estimates the current by calculating the Doppler shift, not only at a single depth but for an entire column up to 1,000 meters long, by measuring the time it takes for each reflection to return.
Data
Data buoys generate a ton of data, and getting it back to shore to make use of it can be a tricky business, especially in areas where radio coverage is spotty. Buoys moored close to shore can transmit their data via a simple cellular modem, while moorings further out into the ocean have to rely on satellites like GOES to send their data. Either way, all the sensors in a data buoy are connected to a data logger, which does any necessary signal conditioning and queuing of data before sending it to shore. To the degree that there’s an industry standard for data buoy loggers, it would likely be Campbell Scientific; a lot of data buoys seem to use them, and we’ve seen them before in other “Remotely Interesting” installments, such as the SNOTEL network and in the weather station on the summit of Mount Everest.
Shoreside data handling tends to be pretty complicated, given how geographically dispersed moorings are and the multiple institutions involved in their care and maintenance. Most data buoy operators are universities or oceanographic research institutions, which tend to get the first crack at the data. These groups do initial processing and quality assurance on the data before uploading it to one or more of the consortiums for development into data products for their clients.


Here’s a data buoy associated with the university I work at! It’s rad to see all the open data: http://data.moby.mlml.sjsu.edu/
Looks like you might have a problem with your batteries?
I remember seeing a tv special about an attempt to exhaustively measure everything they could about a few square miles(larger?) of open ocean in the 70s or early 80s. There was one largish central buoy and another several dozen devices deployed in the area. Some were free floating and were designed to float at a certain depth. I don’t think I dreamed it but I can’t remember what channel or program I saw it on. Perhaps a Jacque Cousteau
This a rad article!!!
So stoked to see buoys getting some love! I am a surfer who actually makes art sculptures that visualize NOAA buoy data using light (swell direction, swell period, and swell height!)!
You can check my art out @seanobriendesigns 🤙
Fantastic work @Sean , really beautiful. Can it be converted to a big 3D printer to make a sculpture?
At supercon this year I met the very cool Wayne Pavlanko, who created an open source ocean version called MakerBouy. It’s seen several years of use by now and imo it’s a really sick example of the synergy between open source and the scientific community.
Here’s an article talking about it: https://www.jhuapl.edu/news/news-releases/191111-basement-tinkerer-pavalko-helps-clean-ocean
OK… so when does Rhianna hit the alien?
Back in the early 80s, I worked for a company that processed wave height data (creating spectral density functions) for use in validating ocean models. The ocean model produced wave height spectral density functions for the available data–thus producing a hindcast. The validation compared the hindcast to the historical data. The company also deployed systems used by heavy-lift (>5k tonnes) crane vessels, drilling vessels, and emergency vessels. These systems used “Waverider” bouys (ISTR they were produced by a Dutch company) to obtain real-time wave data that was then used to predict the vessel’s motions during critical operations.
Given how hard the sea will f*** anything you put in it, I’d love to see more detail on how they make these things weather & water proof as it could yield a lot of useful tips for anyone making stuff that works outdoors.
who made the graphic at the top? its incredible and as an engineer for research buoys that contribute to NDBC’s network – id love to have a high-res print!
It’s made by our art director, Joe Kim. It’s our copyright, but if you’re going to use it noncommercially, we’ve got nothing against it.
You can play with the URL to get it full-size.
In your research did you find anything related to data collection before the 1950s? I’m trying to finda data source for Nino graphs that go back to the 1800s. Thank you for all your efforts regarding buoys!