With summer just underway here in North America, it may seem like a strange time to talk about snow. But when you live in North Idaho, winter is never very far away and is always very much on everyone’s mind. Our summers are fierce but all too brief, so starting around September, most of us begin to cast a wary eye at the peaks of the Bitterroot range in the mornings, looking for the first signs of snow. And in the late spring, we do much the same, except longingly looking for the first signs that the snowpack is finally breaking up.
We all know how important snow is, of course. Snow is our lifeline, nearly the only source of drinking water we have here, as well as the foundation of our outdoor recreation industries. We also know that the snowpack determines our risk for wildfires, so while the long, dark winters may take a psychological toll, the longer the snow stays on the mountains, the less chance we have of burning come summer.
These are all very subjective measures, though, and there’s way too much riding on the snowpack to leave it up to casual observation. To make things more quantitative, the US Department of Agriculture’s Natural Resources Conservation Service (NRCS) has built a system across the western US that measures the snowpack in real-time, and provides invaluable data to climatologists, fish and game managers, farmers, and even the recreation industry, all of whom have a vested interest in the water held within. The network is called SNOTEL, and I recently got a chance to take a field trip with a hydrologist and get an up-close look at how it works.
Courses and Cores
I got interested in SNOTEL thanks to local meteorologists, who all seem even more snow-obsessed than we civilians. This year, despite many seemingly endless hours behind the snowblower clearing the driveway, their reports were consistently showing that the snowpack was behind expectations. It seemed counterintuitive, so to understand how they came to this conclusion, I sniffed around a bit until I stumbled on SNOTEL, the snow telemetry network.
SNOTEL is just the kind of system that pushes all my buttons — a widely distributed network of weather sensors that have to operate reliably under harsh conditions with minimal maintenance in some of the most remote and rugged locations in the United States. With the NRCS interactive SNOTEL map showing a few sites within reasonable driving distance, I took a chance and dropped an email to Pete Youngblood, an NRCS hydrologist based out of the local field office right here in town. To my surprise, Pete got right back to me — turns out he’s a Hackaday reader! — and offered to take me on a guided tour of a site when he did his annual maintenance visit. I eagerly accepted.
During the ride up to the site in Pete’s big four-wheel-drive truck, he explained that he’s responsible for 25 SNOTEL sites across North Idaho and has to visit each of them between June and September. That’s a tall order, since the sites are widely scattered and often extremely remote, sometimes requiring four or more hours of driving down twisting forest roads. Several sites are so far out that they can only be reached by hiking in — a tough proposition with all the tools and materials needed for annual maintenance. Other sites can only be reached by helicopter.
While the site we visited — I’ll be obfuscating the exact location so as not to exacerbate the vandalism problem, which only adds to Pete’s workload — was far more accessible than any of those extreme sites, it was still pretty out there. Pete told me that current SNOTEL sites by and large echo the old snow survey routes established over a century ago by Dr. James E. Church of the University of Nevada, who recognized the need for a system of measuring snowpack levels across watersheds in the western USA.
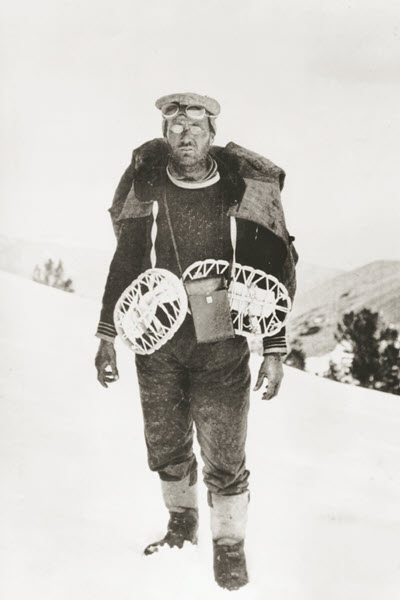
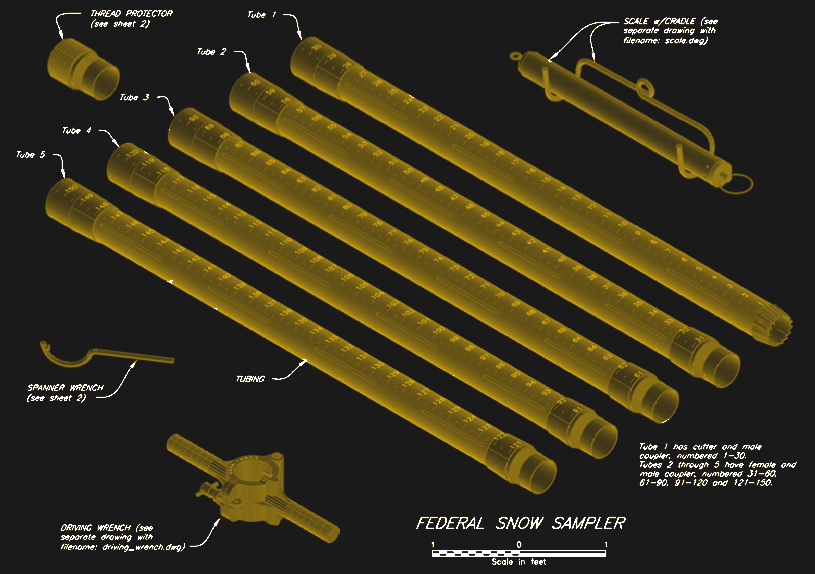
Dr. Church, a classics professor as well as an avid mountaineer, developed the precursor to the current Federal Snow Sampler, the tool that is still used to this day for taking manual snow measurements. It consists of multiple short sections of tubing that can be easily packed in and assembled on-site. The tube is pushed through the snow until it hits soil; the snow water equivalent — the depth of water that would result if the snow mass melted completely — is calculated using a complicated formula that takes into account the weight of the core sample, which is measured right in the field.
He also established a network of survey sites in critical watersheds, which were formalized and expanded over the years as his methods proved their value. These snow courses are still surveyed manually to this day, which helps to validate the readings taken by the automated SNOTEL stations, many of which were set up along the old snow courses.
Pete spends a lot of his winter snowshoeing along snow courses to take manual measurements; he invited me along on one of those outings, but I’ll have to practice my snowshoeing skills if I’m going to take him up on that.
Forbidden Pillow Juice
The site we visited is pretty typical for the SNOTEL network. Most sites have a basic complement of standard meteorology instruments — anemometer and wind gauge, air and soil temperature, and the like — but the stars of the show are the snow pillow and the precipitation gauge. The snow pillow is pretty clever — it’s basically a liquid-filled bladder lying on a very flat section of ground. The bladder is connected to the nearby instrument shack by a buried length of tubing, which continues up the inside wall of the shack. Snow accumulates on the pillow over the winter, increasing the hydrostatic pressure and pushing the fluid up the tubing. A transducer measures the pressure continuously over the winter, allowing hydrologists to determine the SWE at the site.
The snow pillow presents some practical engineering challenges, not least of which is hauling hundreds of gallons of fluid to remote areas to fill them up. The fluid also needs to not freeze, so a non-toxic antifreeze like propylene glycol needs to be used. That also presents a problem since such solutions are often sweet, which attracts bears. This means that snow pillows in grizzly country — which we were very much in — need to be protected with multiple layers of chain-link fencing material, firmly anchored to the ground. As an aside, Pete said that outside of bear country, snow pillows without protection make a great place to set up sleeping bags during overnight trips; your very own forest waterbed.
The other prominent instrument at a SNOTEL site is the precipitation gauge. It’s like a rain gauge on steroids — a huge aluminum pipe about 10″ (25 cm) in diameter, and about 10 feet (3 meters) tall. Like the snow pillow, the precip gauge hydrostatically measures the snow and rain that accumulate inside it, at first layering on top of the denser antifreeze and eventually mixing with it. Pete spent most of his time draining off the old antifreeze from the precip gauge and putting a fresh charge in from two jerry cans he lugged in from the truck.
Since most SNOTEL sites are generally way, way off the grid, site power has to be solar. Each shelter has a pole-mounted solar panel, a charge controller, and a couple of deep-cycle batteries to keep everything running. Power requirements are modest, especially since the VHF meteor-bounce radios that once connected all the sites to Boise have been replaced by GOES satellite, Iridium links, or as in the case of the site we visited, cellular modems.


Making It All Make Sense
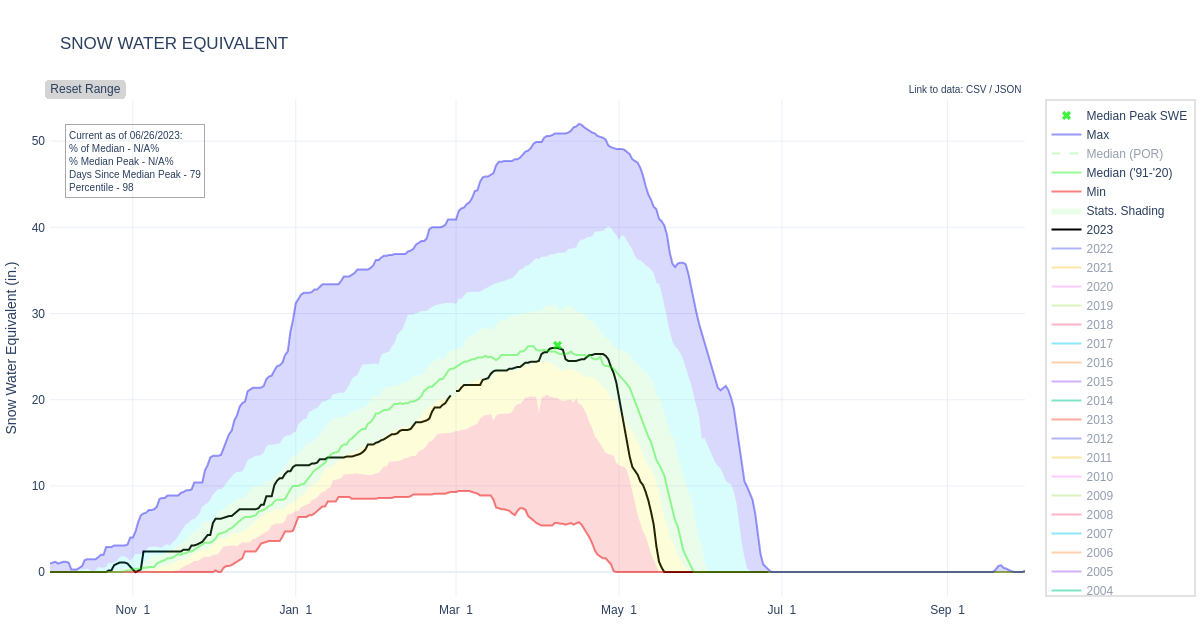
However the raw data make it back to the NRCS, that’s only the beginning. Hydrologists like Pete need to turn raw readings of snow depth, soil temperature and moisture, and accumulated precipitation into one of many data products offered to end users. There really is a bewildering array of products available at the click of a mouse, including maps, graphs, and tabular reports. As a civilian, I found the most revealing to be the snow-water equivalent charts, which show the snow packs over the current “snow year” — October 1 to September 30 — as a function of SWE. The chart below is for the site we visited, and shows the current snow year in black. Compared to the median of the 1991 to 2020 readings (solid green line), the snowpack was looking pretty much average right up until the first of May, when we got a sudden warm spell and the snow rapidly disappeared. In a 70th-percentile year (aqua area), we would still have seen snow on the pillow when we visited in mid-June.
It’s hard to overestimate the value that SNOTEL brings to those of us living in the West, even if the network and the people behind it go largely unnoticed. People like Pete put an awful lot of effort into keeping the system running and making sense out of the data, and I just want to say thanks to him for taking the time to show me around and patiently field my questions. Thanks Pete!


Thanks for the great article!
I worked in the Sierra Nevada with the California Department of Water Resources updating and augmenting SNOTELs. Best job ever and captured important data to boot!
This is an outstanding article and pretty darn good investigative journalism in general. Thanks again.
SWE = snow water equivalent
Very cool! I saw one of these grids way up in the Sierra Nevada a couple years ago (summer) and guessed that’s what they were for, neat to read more about how they work.
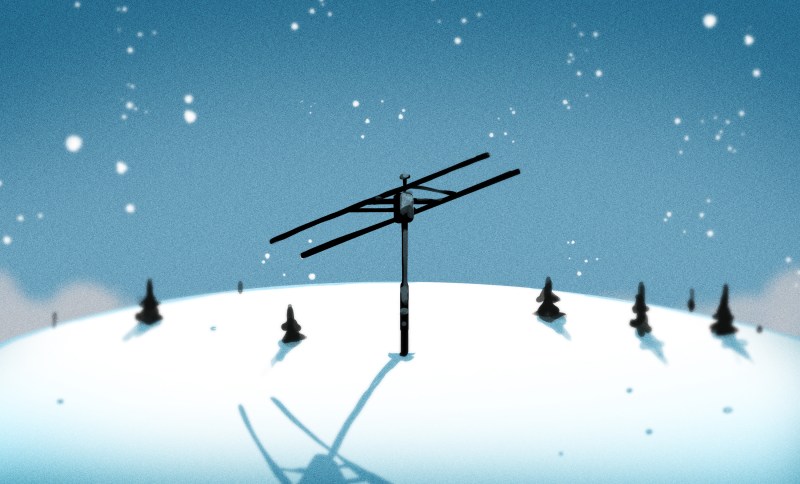
Used to work for MCC doing field testing for the MB WANs, SNOTEL being one of the major users (river levels being another). The huge LP antennas were a PITA. Most of MB TX/RX happens at the low end of VHF, 30-50 mHz.
Cool article
When did they go away from meteor scatter? I thought that was still
running.
One day—–the dependence on sats could hurt us. :(
But that is just the future I guess
“One day—–the dependence on sats could hurt us. :(”
And it WILL….one day. Either a war or the sun will take
a bunch out. :(
The pillow method is quite clever. It’s not a trivial thing to measure; other means include neutron scattering sensors which place a radioactive source on a tall pole and measure the back-scatter of neutrons from the water (snow) below. There’s also radar based sensors, sonar based sensors, but these don’t measure water equivalent directly.
And of course the good old guy on skis with a stick method, like it’s been done for ages…
Some SNOTEL stations are very accessible. Chair 2 at Taos Ski Valley passes right over the Taos Powderhorn station.
The custom analogue interface board is an interesting way to make sure everything is connected to the correct vdiff ports, but they missed the opportunity to roll it into an sdi12 converter to connect to the Campbells logger. Also why were the models of the logger and modem (a CR1000 and RV50 respectively) censored?
“often extremely remote, sometimes requiring four or more hours of driving”
laughs in Australian