Get Your SQL Statements Right The First Time With SQL Lint

What’s your average success rate of getting a SQL statement right on the first try? In best case, you botched a simple statement without side effects and just have to try again with correct syntax or remove that typo from a table name, but things can easily go wrong fast here. But don’t worry, the days of fixing it on the fly can be over, thanks to [Joe Reynolds] who wrote a linter for SQL.

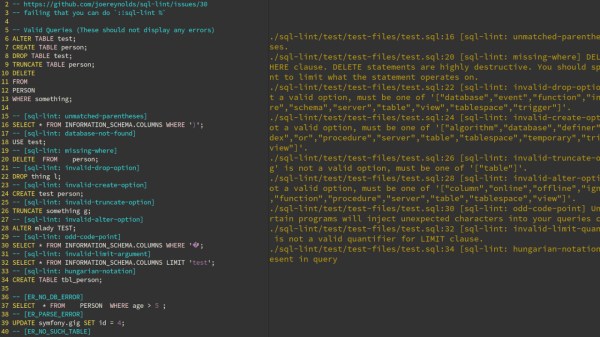
A linter parses code to tell you where you screwed up. While checking SQL syntax itself is somewhat straightforward, [Joe]’s sql-lint tool will also check the semantics of it by looking up the actual database and performing sanity checks on it. Currently supporting PostgreSQL and MySQL, it can be either run on a single SQL file or a directory of files, or take input directly from the command line. Even better, it also integrates within your editor of choice — assuming it supports external plugins — and the documentation shows how to do that specifically for Vim.

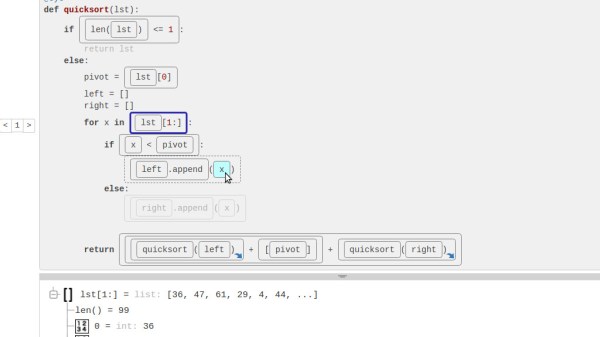
If you can look past the fact that it’s written in TypeScript and consequentially results in a rather large executable (~40 MB), it might serve as an interesting starting point for the language itself, or adds a new perspective on writing this type of analyzer. And if databases aren’t your terrain, how about shell scripts?

Continue reading “Get Your SQL Statements Right The First Time With SQL Lint”

Crash Your Code – Lessons Learned From Debugging Things That Should Never Happen™

Let’s be honest, no one likes to see their program crash. It’s a clear sign that something is wrong with our code, and that’s a truth we don’t like to see. We try our best to avoid such a situation, and we’ve seen how compiler warnings and other static code analysis tools can help us to detect and prevent possible flaws in our code, which could otherwise lead to its demise. But what if I told you that crashing your program is actually a great way to improve its overall quality? Now, this obviously sounds a bit counterintuitive, after all we are talking about preventing our code from misbehaving, so why would we want to purposely break it?

Wandering around in an environment of ones and zeroes makes it easy to forget that reality is usually a lot less black and white. Yes, a program crash is bad — it hurts the ego, makes us look bad, and most of all, it is simply annoying. But is it really the worst that could happen? What if, say, some bad pointer handling doesn’t cause an instant segmentation fault, but instead happily introduces some garbage data to the system, widely opening the gates to virtually any outcome imaginable, from minor glitches to severe security vulnerabilities. Is this really a better option? And it doesn’t have to be pointers, or anything of C’s shortcomings in particular, we can end up with invalid data and unforeseen scenarios in virtually any language.

It doesn’t matter how often we hear that every piece of software is too complex to ever fully understand it, or how everything that can go wrong will go wrong. We are fully aware of all the wisdom and cliches, and completely ignore them or weasel our way out of it every time we put a /* this should never happen */ comment in our code.

So today, we are going to look into our options to deal with such unanticipated situations, how we can utilize a deliberate crash to improve our code in the future, and why the average error message is mostly useless.

Continue reading “Crash Your Code – Lessons Learned From Debugging Things That Should Never Happen™”

Warnings On Steroids – Static Code Analysis Tools

A little while back, we were talking about utilizing compiler warnings as first step to make our C code less error-prone and increase its general stability and quality. We know now that the C compiler itself can help us here, but we also saw that there’s a limit to it. While it warns us about the most obvious mistakes and suspicious code constructs, it will leave us hanging when things get a bit more complex.

But once again, that doesn’t mean compiler warnings are useless, we simply need to see them for what they are: a first step. So today we are going to take the next step, and have a look at some other common static code analysis tools that can give us more insight about our code.

You may think that voluntarily choosing C as primary language in this day and age might seem nostalgic or anachronistic, but preach and oxidate all you want: C won’t be going anywhere. So let’s make use of the tools we have available that help us write better code, and to defy the pitfalls C is infamous for. And the general concept of static code analysis is universal. After all, many times a bug or other issue isn’t necessarily caused by the language, but rather some general flaw in the code’s logic.

Continue reading “Warnings On Steroids – Static Code Analysis Tools”

Warnings Are Your Friend – A Code Quality Primer

If there’s one thing C is known and (in)famous for, it’s the ease of shooting yourself in the foot with it. And there’s indeed no denying that the freedom C offers comes with the price of making it our own responsibility to tame and keep the language under control. On the bright side, since the language’s flaws are so well known, we have a wide selection of tools available that help us to eliminate the most common problems and blunders that could come back to bite us further down the road. The catch is, we have to really want it ourselves, and actively listen to what the tools have to say.

We often look at this from a security point of view and focus on exploitable vulnerabilities, which you may not see as valid threat or something you need to worry about in your project. And you are probably right with that, not every flaw in your code will lead to attackers taking over your network or burning down your house, the far more likely consequences are a lot more mundane and boring. But that doesn’t mean you shouldn’t care about them.

Buggy, unreliable software is the number one cause for violence against computers, and whether you like it or not, people will judge you by your code quality. Just because Linus Torvalds wants to get off Santa’s naughty list, doesn’t mean the technical field will suddenly become less critical or loses its hostility, and in a time where it’s never been easier to share your work with the world, reliable, high quality code will prevail and make you stand out from the masses.

Continue reading “Warnings Are Your Friend – A Code Quality Primer”

Stepping Up Your Python Printf Debugging Game

Debuggers come in all shapes and sizes, offering a variety of options to track down your software problems and inspecting internal states at any given time. Yet some developers have a hard time breaking the habit of simply adding print statements into their code instead, performing manual work their tools could do for them. We say, to each their own — the best tools won’t be of much help if they are out of your comfort zone or work against your natural flow. Sometimes, a retrospective analysis using your custom-tailored debug output is just what you need to tackle an issue.

If the last part sounds familiar and your language of choice happens to be Python, [Alex Hall] created the Bird’s Eye Python debugger that records every expression inside a function and displays them interactively in a web browser. Every result, both partial and completed, and every value can then be inspected at any point inside each individual function call, turning this debugger into an educational tool along the way.

With a little bit of tweaking, the web interface can be made remote accessible, and for example, analyze code running on a Raspberry Pi. However, taking it further and using Bird’s Eye with MicroPython or CircuitPython would require more than just a little bit of tweaking, assuming there will be enough memory for it. Although it wouldn’t be first time that someone got creative and ran Python on a memory limited microcontroller.